
Data Analyst Portfolio Projects: What Modern Hiring Managers Evaluate
Building high-impact data analyst portfolio projects is the single most decisive factor that separates candidates who get recruiter callbacks from those who are ignored in 2026. In the contemporary technology hiring landscape, the traditional resume has lost its historical authority. With universities graduating record numbers of analytics majors annually and commercial coding bootcamps producing thousands of students with identical certificates of completion, technical recruiters and senior analytics managers are inundated with hundreds of applicants for every junior opening. In this hyper-competitive market, claiming that you know SQL, Power BI, or Python on a resume is completely unverified. A public, commercial-grade portfolio is undeniable proof of competence. For verified technical documentation and standards, refer to Kaggle Open Source Datasets Repository.
However, over 90% of self-taught applicants assemble portfolios that actively damage their hiring prospects. They commit what industry recruiters refer to as the ‘Titanic Trap’: filling their public GitHub repositories with identical copies of generic academic tutorial exercises (the Titanic survival dataset, the Iris flower classification, or basic Boston housing prices). When senior hiring managers see these projects, they immediately recognize that the applicant followed a scripted tutorial and cannot solve unguided commercial dilemmas.
To secure interviews, your portfolio must showcase commercial problem solving. Below are 5 high-impact, commercial-grade data analytics project blueprints using free public datasets that will prove your job readiness. To calculate your complete learning roadmap timeline, use our Career Roadmap Planner.
Data Analyst Portfolio Projects 1: E-Commerce Cohort Retention
Commercial Context for Data Analyst Portfolio Projects
Framing data analyst portfolio projects around bottom-line business ROI instantly captures recruiter interest.
A direct-to-consumer e-commerce enterprise observed an unexpected 14% contraction in gross customer retention across mid-market cohorts over two consecutive quarters. Marketing executives need an analytical audit to determine whether this attrition is driven by product quality, shipping transit delays, or marketing discount fatigue, and quantify the revenue recovery potential.
Data Architecture & Technical Stack
- Recommended Free Dataset: Olist Brazilian E-Commerce Public Dataset (Kaggle) — Over 100,000 anonymized real customer orders with shipping timestamps, reviews, product categories, and payment methods.
- Core Toolset: Relational SQL (PostgreSQL), Power BI / Tableau.
- Key Metrics to Compute: 30-60-90 Day Repeat Purchase Velocity, Customer Lifetime Value (LTV) segmented by acquisition channel, Net Delivery Lead Time vs Review Score correlation, and RFM (Recency, Frequency, Monetary) customer segmentation.
What Recruiters Look For in Data Analyst Portfolio Projects
Clear documentation, reproducible code, and commercial intuition elevate top data analyst portfolio projects.
Show that you can write advanced SQL Window Functions to determine the exact number of days elapsed between a customer’s first and second transaction. Present an executive Star Schema in Power BI linking Fact Orders to Dim Customers, complete with dynamic date slicers and clear revenue recovery initiatives.
Data Analyst Portfolio Projects 2: Loan Default Risk Model
The Commercial Dilemma
A digital consumer lending institution has experienced higher-than-forecasted default rates across its B and C credit risk tiers. Underwriting executives require an analytical audit identifying which borrower attributes (debt-to-income ratio, revolving line utilization, inquiry volume) are the primary leading indicators of early payment defaults.
Data Architecture & Technical Stack
- Recommended Free Dataset: Lending Club Loan Data (Kaggle / Public Records) — Complete historical records of funded unsecured personal loans including interest rates, loan status, and borrower credit profiles.
- Core Toolset: Relational SQL (CTEs, aggregations), Python (Pandas, Seaborn) or Power BI.
- Key Metrics to Compute: Cumulative Default / Charge-Off Rate by loan origination vintage, Debt-to-Income (DTI) distribution across performing vs non-performing accounts, Loss Given Default (LGD), and Net Portfolio Yield (interest income earned minus principal charge-offs).
What Recruiters Look For
Demonstrate that you understand financial survivorship bias: exclude recently originated, non-matured loans when calculating historical default curves. Build scenario sensitivity parameters that simulate the financial impact of capping debt-to-income ratios at 35%.
Project 3: Hospital 30-Day Readmission Risk & Clinical Operations Audit
The Commercial Dilemma
A regional hospital healthcare network faces substantial federal penalty exposure due to above-average 30-day readmission rates in cardiovascular and diabetic patient cohorts. Clinical directors need an operational dashboard highlighting admission pathways, diagnostic code clusters, and length-of-stay correlations.
Data Architecture & Technical Stack
- Recommended Free Dataset: Diabetes 130-US Hospitals Clinical Care Dataset (UCI Machine Learning Repository) — Over 100,000 inpatient encounters across 130 US medical facilities across a 10-year observation span.
- Core Toolset: SQL (data cleansing, CASE statements), Tableau / Power BI.
- Key Metrics to Compute: 30-Day Readmission Rate across primary diagnosis categories, Average Length of Stay (ALOS) vs readmission correlation, Medication Change Index, and Emergency vs Elective admission risk variance.
What Recruiters Look For
Showcase disciplined data governance and ethics: document HIPAA compliance safeguards, patient de-identification techniques, and clinical diagnostic grouping using SQL CASE statements.
Project 4: Multi-Channel Marketing Attribution & ROAS Optimization
The Commercial Dilemma
A subscription retail company spending $500,000 monthly across Google Search, Meta Social, TikTok, and Affiliate channels is observing contradictory conversion reporting. Last-click attribution over-credits branded search ads while completely undervaluing top-of-funnel social campaigns, leading to misallocated marketing budgets.
Data Architecture & Technical Stack
- Recommended Free Dataset: Multi-Channel Digital Marketing Ad Logs (Kaggle) — Impression timestamps, click identifiers, UTM campaign tags, and checkout conversion values.
- Core Toolset: Python (Pandas) or SQL CTEs, Power BI.
- Key Metrics to Compute: Return on Ad Spend (ROAS) and Customer Acquisition Cost (CAC) by channel, First-Touch vs Last-Touch vs Linear Attribution modeling variance, Click-Through Rate (CTR), and Time-to-Conversion velocity.
What Recruiters Look For
Prove you understand that marketing is a multi-touch customer journey. Write SQL window functions that order customer touchpoints chronologically and deliver an executive budget reallocation model projecting a 15% increase in total blended revenue.
Project 5: Global Supply Chain Freight Latency & Inventory Turnover
The Commercial Dilemma
An international manufacturing distribution network is suffering from stockouts in high-velocity product categories while simultaneously incurring massive warehouse holding costs on slow-moving inventory. Operations leadership needs visibility into international transit bottlenecks, supplier lead time variance, and optimal reorder points.
Data Architecture & Technical Stack
- Recommended Free Dataset: DataCo Smart Supply Chain Dataset (Kaggle) — Over 180,000 transaction events detailing shipping modes, delivery status, transit delays, and profit margins.
- Core Toolset: SQL, Power BI / Tableau, Excel.
- Key Metrics to Compute: On-Time In-Full (OTIF) delivery percentage, Supplier Lead Time Variance (Actual transit days vs Promised contractual delivery days), Inventory Turnover Ratio, and Freight cost per ton-mile.
What Recruiters Look For
Demonstrate supply chain acumen: conduct an ABC inventory classification in SQL or Python categorizing SKUs by revenue velocity. Deliver an actionable root-cause report isolating the top three international shipping corridors driving 60% of delayed shipments.
How to Package and Present Projects for Maximum Recruiter Impact
Building the technical analysis is only half the battle. How you package your work determines whether recruiters advance you to interview rounds:
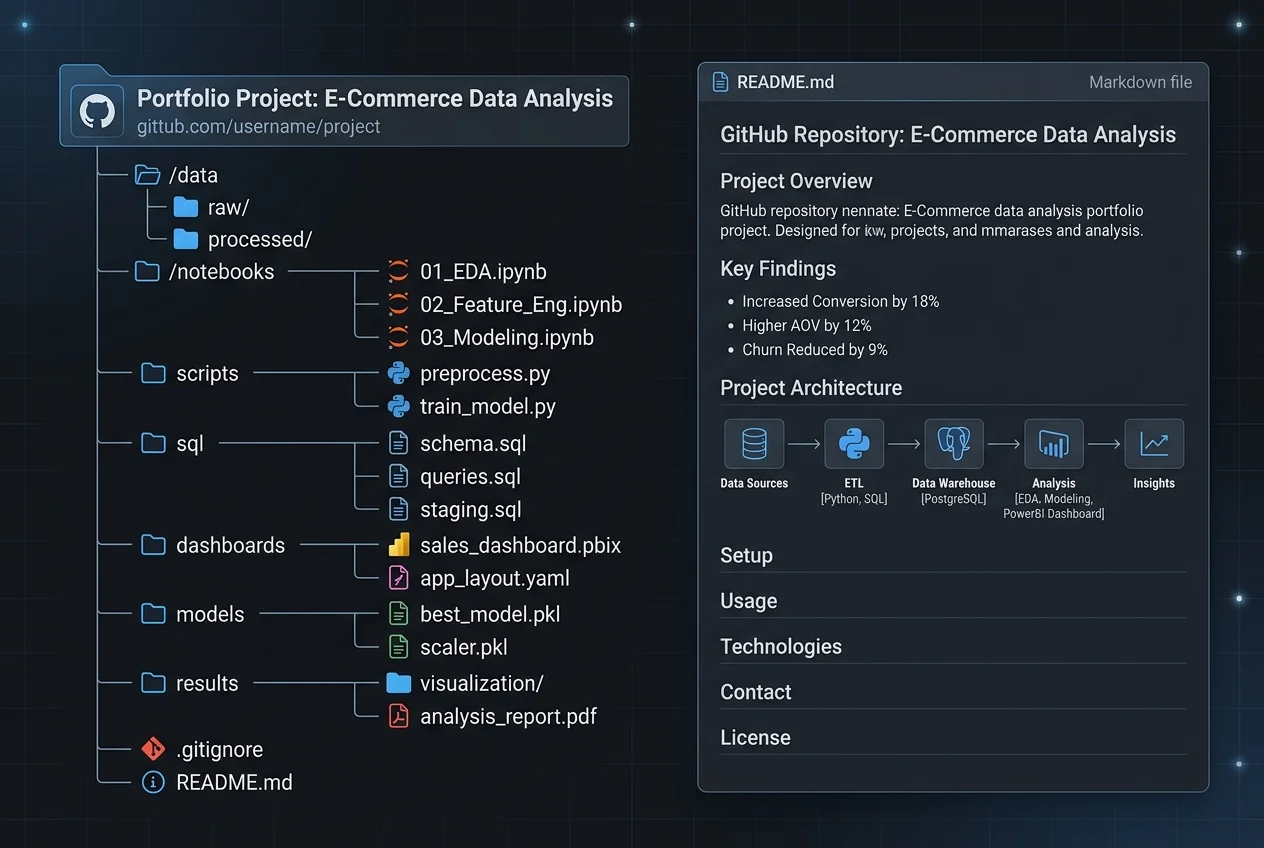
- Clean GitHub Directory Hygiene: Structure your repository with dedicated folders for
sql/scripts,notebooks/,dashboard/files, and a comprehensiveREADME.md. - Live Cloud Dashboard Links: Always provide a direct link to an interactive version of your dashboard hosted on NovyPro or Tableau Public so non-technical recruiters can test your interface immediately without downloading desktop software.
- The STAR Interview Method: When asked to present a project during a technical screen, allocate 20% of your time to the business Situation, 20% to the technical Task, 40% to your analytical Action, and 20% to the commercial ROI Result.
To generate customized project briefs tailored to other industry verticals, use our free Portfolio Project Generator. To evaluate how these projects accelerate your compensation across global markets, explore our Tech Salary & Career ROI Calculator.
Technical Interview Whiteboarding & Live Case Study Defense
Assembling an impressive commercial portfolio is only the first phase of the recruitment process. Once your GitHub repositories and interactive cloud dashboards pass initial recruiter screens, you will be invited to defend your methodology in live technical case study interviews. Senior analytics managers and lead data engineers will probe your code to evaluate your analytical maturity and business logic.
The 3 Tough Technical Challenges Interviewers Ask
- The Scalability Probe: ‘Your SQL script and Power BI dashboard run smoothly on this 100,000-row Kaggle dataset. How would your architecture adapt if transaction volume scaled to 50 million rows daily?’ Be prepared to discuss incremental data refresh strategies, database indexing, summary aggregation tables, and migrating from desktop memory to distributed cloud warehouses like Snowflake or Google BigQuery.
- The Data Hygiene Challenge: ‘How did you identify and handle missing values, and how did your choice of imputation affect your downstream statistical metrics?’ Explain why you chose median imputation over mean imputation to prevent outlier distortion, or explain how you segregated corrupted records into a dedicated audit table rather than silently deleting them.
- The Commercial ROI Defense: ‘If an executive disagrees with your strategic recommendations, how do you defend your findings using quantitative data?’ Demonstrate how you calculated confidence intervals, analyzed historical precedent, and framed recommendations around financial risk mitigation rather than personal intuition.
Data Analyst Portfolio Projects: Frequently Asked Questions
How many projects should I showcase in my data analyst portfolio?
Three deeply documented, commercial-grade projects are ideal. Having three comprehensive case studies solving authentic corporate challenges is vastly superior to having ten superficial tutorial copies. Focus on demonstrating end-to-end competence across data extraction, data cleansing, modeling, visualization, and executive business communication.
Can I build my portfolio projects using free software?
Yes. PostgreSQL, Python, JupyterLab, and Microsoft Power BI Desktop are 100% free to download and use on personal computers. You can build, test, and package complete enterprise-grade projects without spending a dollar on software licenses.
Should I host my portfolio on a custom website or on GitHub?
A professional GitHub profile paired with live interactive cloud dashboard links on NovyPro or Tableau Public is completely sufficient for 95% of corporate positions. Packaging your work cleanly on LinkedIn further amplifies visibility to recruiters.
Published by the SkillRoadmaps Portfolio Strategy Editorial Team | Benchmarked Against Global Hiring Standards