
Data Analyst Roadmap 2026: The Modern Analytics Landscape
Navigating our comprehensive data analyst roadmap 2026 is the fastest and most reliable path to breaking into the data industry as a beginner. The field of data analytics has undergone a massive transformation over the past three years. Gone are the days when knowing basic spreadsheet formulas and building static bar charts was sufficient to secure a high-paying corporate role. In 2026, enterprise data architectures are more distributed, real-time analytics demands are higher, and the integration of artificial intelligence into daily operational workflows requires modern data analysts to operate with technical rigor and commercial acuity. For verified technical documentation and standards, refer to U.S. Bureau of Labor Statistics (BLS).
Today’s data analyst is essentially a hybrid professional: part business strategist, part database engineer, and part narrative storyteller. Organizations across financial services, e-commerce, healthcare, and SaaS are not looking for technicians who merely produce numbers on demand. They are seeking strategic partners who can interrogate complex, uncleaned relational databases, uncover the hidden drivers behind revenue fluctuations or customer churn, and articulate clear, revenue-generating recommendations to executive leadership.
This 2026 Data Analyst Career Roadmap is designed as an end-to-end blueprint to guide self-taught learners and career changers from zero technical background to commercial job readiness. To calculate your personalized weekly timeline and target completion date, use our interactive Career Roadmap & Study Timeline Planner.
Data Analyst Roadmap 2026 Phase 1: Spreadsheets & Business Modeling
Despite the prevalence of advanced programming languages and cloud data warehouses, Microsoft Excel and modern spreadsheets remain the universal lingua franca of business decision-making. Over 80% of executive strategy meetings involve an Excel model or spreadsheet summary. Before writing a single line of database code, you must build absolute fluency in tabular mechanics.
Core Formulas and Matrix Modeling
Move beyond rudimentary SUM and AVERAGE calculations. Professional analysts must master lookup architectures and multi-criteria mathematical evaluations:
- XLOOKUP & Dynamic Two-Way Lookups: Replace vulnerable VLOOKUP statements with robust XLOOKUP implementations utilizing exact match fallbacks, wildcard evaluations, and reverse lookups. Master two-way matrix indexing with INDEX and MATCH for multi-dimensional financial reconciliations.
- Multi-Condition Aggregations: Write complex analytical logic with SUMIFS, COUNTIFS, AVERAGEIFS, and nested logical operators (AND, OR, NOT).
- Dynamic Array Functions: Modern Excel includes powerful array manipulation formulas such as FILTER, UNIQUE, SORT, and TRANSPOSE, allowing you to manipulate and reshape thousands of rows in a single computational cell.
Power Query: The Gateway to Automated ETL
The single most underappreciated tool in modern spreadsheets is Power Query. Power Query introduces analysts to the foundational concepts of ETL (Extract, Transform, Load) pipelines through an intuitive graphical interface backed by the M formula language. Instead of manually copying, pasting, and formatting weekly transaction exports, Power Query allows you to build reproducible ingestion scripts that automatically strip whitespace, unpivot columns, merge heterogeneous datasets, and cast data types with a single refresh click.
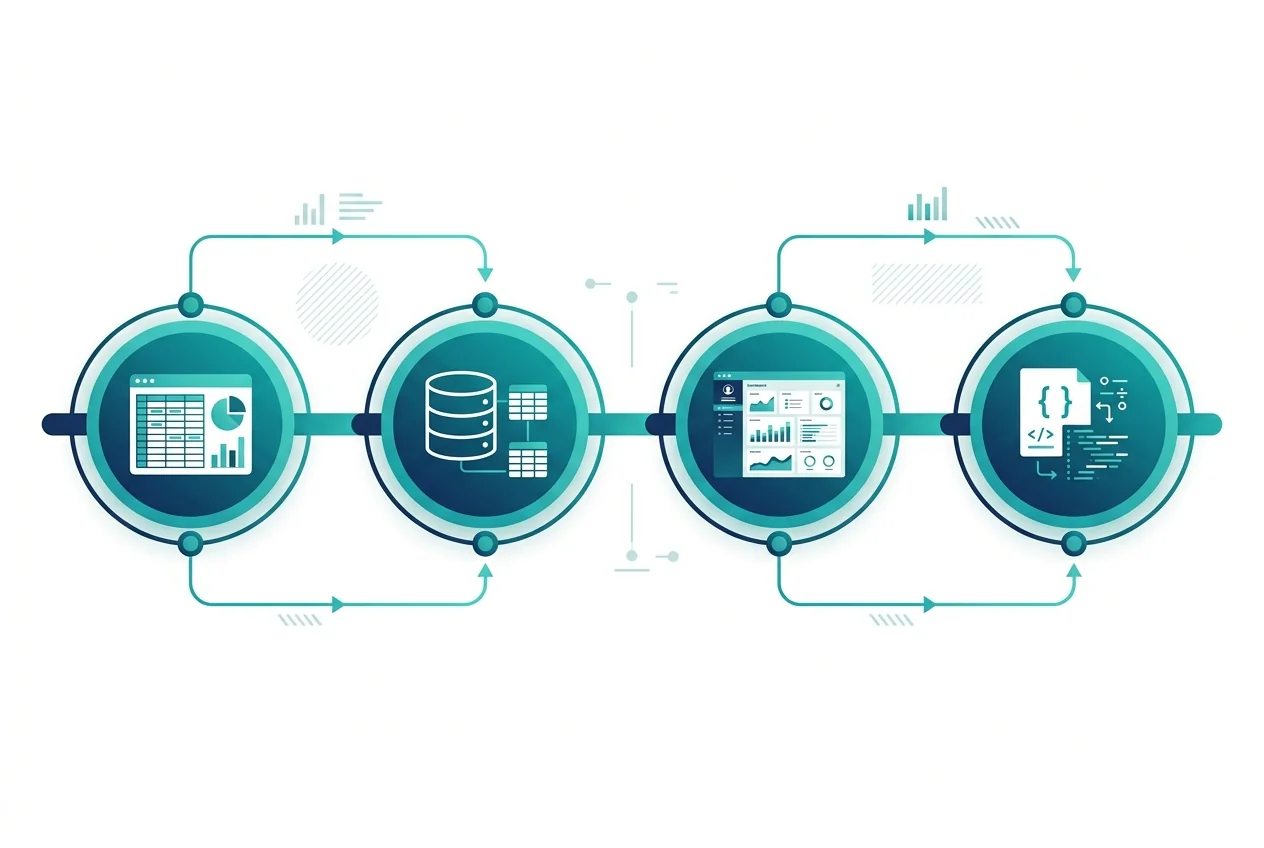
Data Analyst Roadmap 2026 Phase 2: Relational Databases and SQL Mastery
If there is one skill that determines whether a candidate passes a technical screening, it is Structured Query Language (SQL). Business intelligence tools and programming languages experience cyclical hype, but SQL has remained the undisputed foundation of enterprise data retrieval for over four decades. A data analyst who cannot write performant, multi-table queries directly against a relational database is fundamentally dependent on software engineers—a bottleneck no company can afford.
Core Query Mechanics in the Data Analyst Roadmap 2026
Mastering query execution order is essential as you advance through this data analyst roadmap 2026.
Most beginners write SQL queries without understanding how the underlying database engine executes code. Understanding the strict execution hierarchy (FROM → WHERE → GROUP BY → HAVING → SELECT → ORDER BY → LIMIT) is essential for debugging performance bottlenecks and logical errors. For a dedicated daily study curriculum, consult our 30-Day SQL Study Blueprint.
Relational Joins in the Data Analyst Roadmap 2026
Constructing multi-table joins represents a core technical milestone in our data analyst roadmap 2026.
- Relational Joins: Understand the mathematical cardinality differences between INNER JOIN, LEFT JOIN, RIGHT JOIN, and FULL OUTER JOIN. Learn to audit duplicate rows caused by unintended many-to-many relationship explosions.
- Grouping & Granularity: Group metrics accurately across multiple dimensions using GROUP BY while enforcing strict post-aggregation qualification filters with HAVING.
- Common Table Expressions (CTEs): Refactor deeply nested, unreadable subqueries into modular, sequential WITH blocks that other analysts can easily audit, test, and maintain.
Window Functions in the Data Analyst Roadmap 2026
Writing performant analytical window calculations completes Phase 2 of this data analyst roadmap 2026.
Window functions represent the dividing line between junior spreadsheet replacers and senior analytical professionals. By utilizing the OVER clause partitioned by specific dimensions and ordered chronologically, window functions perform row-level calculations across related subsets without collapsing the result set into aggregated summaries:
- Ranking Calculations: Distinguish between ROW_NUMBER (unique sequence), RANK (skips duplicate ties), and DENSE_RANK (maintains continuous numbering) when determining top sales representatives or highest-value transactions.
- Lead & Lag Offsets: Use LAG and LEAD functions to pull prior-period metrics onto the current row, enabling instant calculation of month-over-month revenue growth, churn intervals, and conversion velocity.
- Running Totals & Moving Averages: Formulate rolling window frames (ROWS BETWEEN 6 PRECEDING AND CURRENT ROW) to smooth volatile daily operational metrics into actionable 7-day moving averages.
Phase 3: Business Intelligence Dashboards & Dimensional Data Modeling
Data stored in a relational warehouse provides zero commercial value until an operational leader or department head can interpret it to make a strategic business decision. Business Intelligence tools bridge this gap. However, the greatest mistake made by aspiring analysts is treating BI software like a graphic design canvas. The true differentiator of an elite dashboard is not color palettes—it is dimensional data modeling.
The Star Schema Standard
An executive dashboard built on top of a single, unnormalized flat table with 50 columns will inevitably crawl at sluggish refresh speeds, produce inaccurate calculated totals, and break under scale. Professional analysts architect pure Star Schemas:
- Fact Tables: Central tables containing numeric, quantitative measurements generated at discrete moments in time (e.g., transaction revenue, order quantity, delivery duration, discount percentage).
- Dimension Tables: Surrounding lookup tables containing descriptive contextual attributes (e.g., customer demographics, product hierarchies, store locations, dynamic calendar dates).
- One-to-Many Relationships: Enforcing strict single-direction filter propagation from dimension tables to fact tables to ensure predictable, lightning-fast calculations.
Choosing Between Power BI and Tableau
The enterprise BI landscape is dominated by two powerhouses: Microsoft Power BI and Salesforce Tableau. If your goal is corporate enterprise roles within Microsoft 365 environments, prioritize Power BI and master Data Analysis Expressions (DAX). If you target consulting, tech startups, or visual journalism, Tableau’s flexible exploratory visual analytics engine offers distinct advantages. For an objective side-by-side breakdown, explore our guide: Power BI vs Tableau in 2026: Which to Learn First?.
Phase 4: Focused Python for Analytical Automation
While SQL and Business Intelligence dashboards handle 85% of standard corporate reporting, Python unlocks the remaining 15%. Python allows you to automate repetitive multi-file ingestion routines, execute advanced exploratory data analysis on uncleaned files, and apply empirical statistical models to validate business hypotheses.
Do not waste months attempting to learn full-stack software development, web frameworks, or complex deep learning mathematics. Focus your programming study strictly on four industry-standard analytics packages: NumPy, Pandas, Matplotlib, and Seaborn. Read our specialized curriculum: Python for Data Analysis: The 4-Library Roadmap.
Phase 5: Commercial Portfolio Architecture & Passing the Recruiter Screen
In a saturated entry-level hiring market, certifications alone will not get you hired. Automated completion badges from online course providers prove that you can follow video instructions; they do not prove that you can solve ambiguous commercial dilemmas. Your technical portfolio is your primary competitive differentiator.
The 4 Criteria of an Elite Project Brief
- Commercial Stakes: Clearly state the business problem upfront (e.g., reducing a 14% subscription churn rate or optimizing multi-million dollar inventory holding costs).
- Data Hygiene Reality: Show raw, messy datasets with duplicate records, null values, and formatting discrepancies, documenting how your code sanitized anomalies.
- Deep Analytical Thinking: Incorporate cohort retention matrices, RFM customer segmentation, or multi-touch attribution models.
- Strategic ROI Recommendations: Conclude every project with three actionable business recommendations estimating revenue recovery or cost mitigation potential.
To generate unique, commercial-grade portfolio project briefs complete with free public Kaggle datasets and GitHub README templates, use our free Portfolio Project Generator. Furthermore, you can compare your projected salary bump and career ROI using our Tech Career Salary & Bootcamp ROI Calculator.
Frequently Asked Questions
How long does it take to become a job-ready data analyst in 2026?
For a motivated candidate dedicating 10 to 15 hours of consistent, structured study per week, mastering the core stack (Excel, SQL, Power BI, and Python) takes approximately 4 to 6 months. Spending an additional 4 to 6 weeks assembling three commercial-grade portfolio projects and optimizing your technical resume prepares you for interview pipelines.
Do I need a university degree in Computer Science to get hired?
No. Tech hiring has shifted dramatically toward skill verification over formal educational pedigree. Hiring managers prioritize demonstrable technical output over academic credentials. A candidate who provides a well-organized GitHub repository containing robust SQL audit queries, documented Star Schema data models, and an interactive cloud dashboard will reliably outshine an applicant with an academic degree but zero tangible project evidence.
Should I study Python or SQL first?
Always prioritize SQL before touching Python. SQL is required in virtually 100% of data analyst job openings and has an intuitive, declarative, English-like syntax that provides rapid positive feedback, establishing confidence before you tackle procedural programming languages.
Published by the SkillRoadmaps Engineering & Analytics Editorial Team | Updated for 2026 Global Hiring Standards