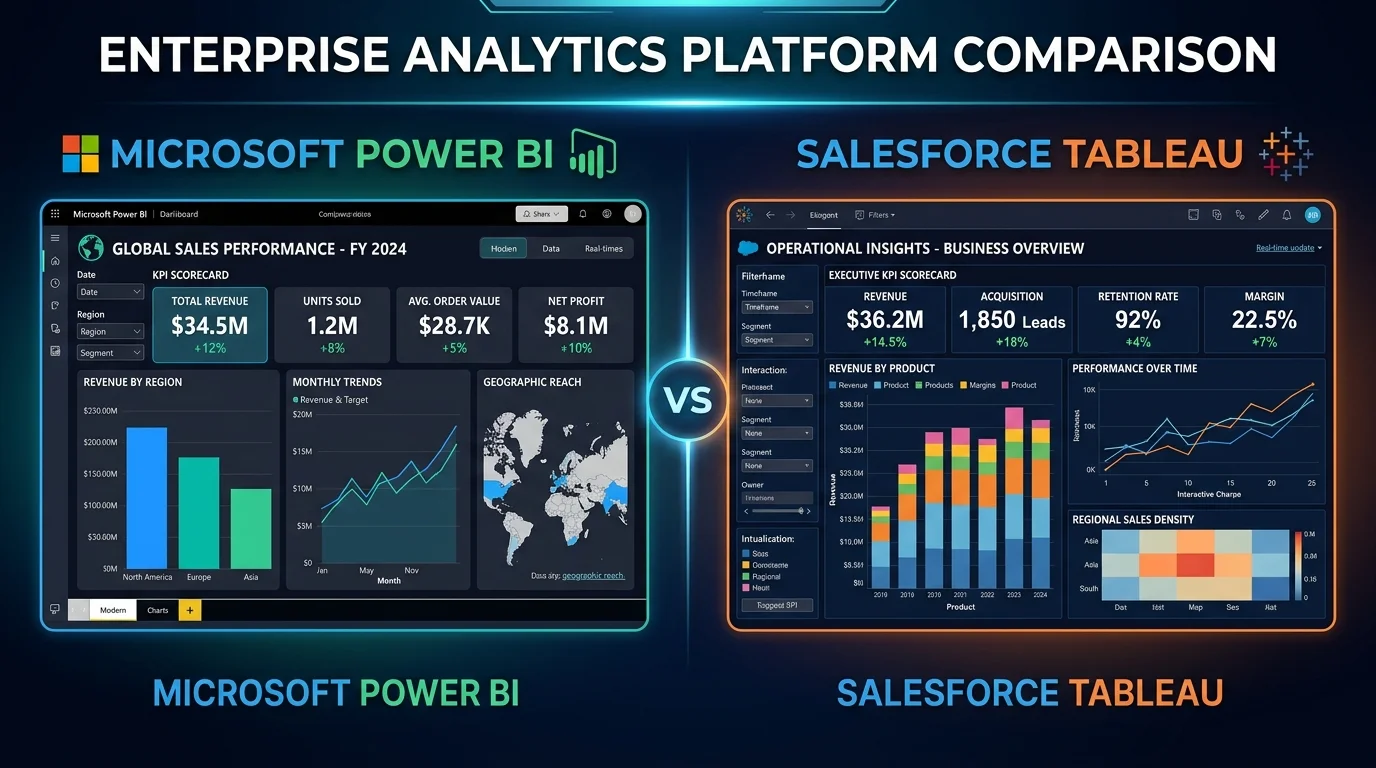

Power BI vs Tableau: The Core Business Intelligence Comparison
The debate between power bi vs tableau remains the most consequential software choice for aspiring business intelligence developers and data analysts in 2026. Selecting the right Business Intelligence (BI) tool is one of the most critical decisions for any aspiring data analyst. In modern enterprise environments, raw data locked in SQL databases provides zero commercial value until operational managers, marketing directors, and C-suite executives can interact with it to make strategic decisions. This is where business intelligence software excels. For verified technical documentation and standards, refer to Microsoft Power BI Architecture Guidance.
For more than a decade, two industry powerhouses have dominated the Gartner Magic Quadrant for Analytics and Business Intelligence: Microsoft Power BI and Salesforce Tableau. While both tools transform complex tabular datasets into visually compelling, interactive dashboards, their architectural philosophies, calculation languages, enterprise ecosystems, and target career trajectories differ fundamentally.
Learners frequently waste months dividing their attention trying to learn both platforms simultaneously, achieving superficial competence in both and mastery in neither. This comprehensive 2026 guide provides an objective, side-by-side analysis of Power BI and Tableau to help you decide which tool aligns with your career objectives. To calculate your complete learning path timeline, use our Career Roadmap Planner.
Power BI vs Tableau 1: Learning Curve & User Experience
The immediate experience of opening Power BI versus Tableau reveals two distinct design and computational mentalities.
Power BI in Power BI vs Tableau: Spreadsheet Evolution
A central consideration in power bi vs tableau is how seamlessly Excel power users adapt to Power BI modeling.
If you have experience with Microsoft Excel, particularly Power Query and Pivot Tables, Power BI will feel immediately familiar. The user interface adheres to standard Microsoft 365 design paradigms. Data ingestion, transformation, and dimensional schema modeling take center stage.
However, the learning curve in Power BI steepens dramatically once you progress beyond basic drag-and-drop visuals into Data Analysis Expressions (DAX). DAX is a functional calculation language designed to evaluate metrics dynamically across row and filter contexts. Mastering DAX requires deep computational discipline; misunderstanding context transition can cause formulas to return erroneous calculations across multi-table models.
Tableau in Power BI vs Tableau: Visual Analytics Canvas
On the data visualization side of power bi vs tableau, Tableau offers unmatched drag-and-drop design freedom.
Tableau was founded by computer scientists and visualization researchers at Stanford University. Its core interface is built around VizQL—a proprietary technology that translates drag-and-drop visual actions directly into database queries. Users construct visualizations by dragging ‘Dimensions’ (categorical descriptors) and ‘Measures’ (numeric values) onto Columns and Rows shelves.
Tableau encourages fluid, exploratory visual experimentation. Building multi-variable scatter plots, geographic maps, and custom chart types feels organic. Its calculation syntax for basic fields is more intuitive for non-programmers than DAX. However, when you require complex calculations across independent dimensional levels, you must master Level of Detail (LOD) expressions (FIXED, INCLUDE, EXCLUDE), which introduces its own conceptual hurdles.
Power BI vs Tableau 2: Data Modeling & ETL Architecture
An executive dashboard is only as reliable as the data model beneath it. This is where the structural divergence between the two tools becomes pronounced.
Data Modeling Superiority in Power BI vs Tableau
DAX calculated columns and star schemas give Power BI a distinct modeling advantage in power bi vs tableau.
Power BI features a world-class, native ETL and data modeling engine. Through integrated Power Query, analysts can connect to hundreds of data sources, apply multi-step transformations, cleanse anomalous records, and normalize schemas without writing backend database scripts. Furthermore, Power BI’s model view provides an intuitive visual interface to architect formal Star Schemas, manage relationship cardinality (one-to-many), and enforce strict cross-filter directions natively on your local machine.
Visual Layer Focus in Power BI vs Tableau
Understanding calculation mechanics is critical when comparing power bi vs tableau for enterprise reporting.
Tableau’s philosophy has traditionally treated data modeling as an upstream engineering responsibility. While modern Tableau includes a flexible relationship layer (‘the noodle’), its internal ETL transformation capabilities are far more limited than Power Query. Complex data cleansing often requires an auxiliary tool such as Tableau Prep Builder or pre-cleaned database views engineered in SQL. Tableau is engineered to sit on top of an already pristine data warehouse and visualize insights with unmatched fluidity.
Power BI vs Tableau 3: Corporate Ecosystem & Enterprise Pricing
Budget constraints and existing corporate IT infrastructure play a decisive role in which tool organizations deploy.
| Feature / Dimension | Microsoft Power BI | Salesforce Tableau |
|---|---|---|
| Desktop Application Cost | 100% Free (Power BI Desktop has zero feature restrictions) | Free version limited to Tableau Public (requires saving data publicly) |
| Commercial Cloud License | $10 – $20 per user/month (Pro / Premium per user) | $75 per user/month (Tableau Creator license) |
| Enterprise Ecosystem | Deeply integrated into Microsoft 365, Teams, Azure, Excel, and Fabric | Native integration into Salesforce CRM, Slack, and AWS architectures |
| Primary Industry Footprint | Corporate enterprise, finance, banking, manufacturing, healthcare | Tech startups, management consulting, data journalism, marketing |
4. Job Market Demand and Career Trajectories
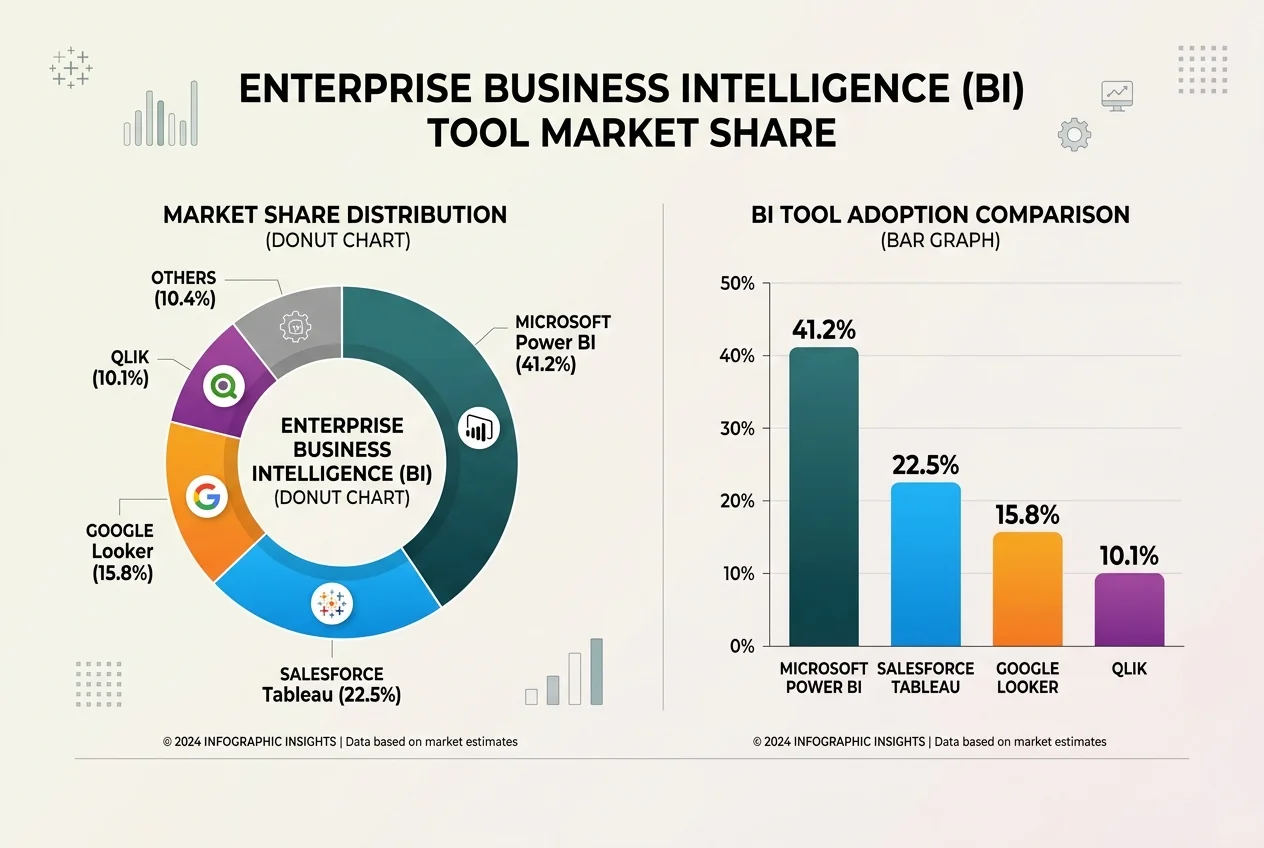
When searching job portals (LinkedIn, Indeed, Glassdoor) across North America, Europe, and global remote hubs, Power BI currently appears in roughly 1.5x to 2x more job postings for generalist Data Analyst and Financial Analyst roles than Tableau. Microsoft’s aggressive pricing strategy and bundling with enterprise Office 365 agreements has driven widespread adoption across small, mid-market, and corporate enterprises.
Conversely, Tableau maintains an elite standing in top-tier tech firms, global consulting practices (McKinsey, BCG, Deloitte), and research institutions where bespoke visual storytelling and advanced aesthetic customization are heavily prioritized. Salaries for senior Tableau practitioners and senior Power BI developers are comparable, with data engineers and analytics engineers commanding six-figure compensation across both ecosystems. Explore our Tech Salary & Career ROI Calculator to evaluate global compensation figures.
The Final Verdict: Which Tool Should You Learn First?
Choose Power BI First If:
- You want to maximize the sheer volume of entry-level corporate data analyst job applications.
- You already possess solid familiarity with Excel formulas and want to learn enterprise dimensional modeling.
- You are targeting roles in corporate finance, operational logistics, manufacturing, or healthcare.
- You want a completely free desktop learning environment that does not force you to publish sensitive practice datasets to the public web.
Choose Tableau First If:
- You are targeting management consulting firms, creative agencies, tech enterprises, or academic research.
- You prioritize aesthetic visual design, geographic mapping, and fluid exploratory analysis over backend data modeling.
- Your prospective target employers operate primarily within the Salesforce, Slack, or AWS cloud ecosystems.
Regardless of your choice, remember that business intelligence software is merely the final presentation layer. Without strong foundational skills in relational SQL and commercial portfolio storytelling, mastery of visualization software alone will not secure an interview.
Enterprise Governance, Tabular Editor & Performance Tuning in BI
As organizations scale their business intelligence operations, managing hundreds of ad-hoc reports and sprawling semantic models becomes an enterprise liability. Both Power BI and Tableau provide specialized toolsets to maintain report governance, enforce data security, and optimize sluggish refresh pipelines.
Calculation Groups & Tabular Editor in Power BI
One of the most powerful enterprise capabilities in Power BI is the utilization of Calculation Groups via external tools like Tabular Editor. In standard report development, analysts often find themselves creating dozens of redundant time-intelligence measures (e.g., Sales YTD, Profit YTD, Cost YTD, Quantity YTD). By implementing a Calculation Group with dynamic DAX evaluation, you can create a single time-intelligence calculation item that dynamically applies to any selected base measure, reducing model bloat by up to 80% and drastically simplifying maintenance.
Row-Level Security (RLS) & Multi-Tenant Data Governance
In corporate environments, different stakeholders must view distinct slices of the same core dashboard based on their organizational role or geographic territory. Both platforms offer robust Row-Level Security:
- Power BI DAX RLS: Define dynamic security filters using the
USERPRINCIPALNAME()DAX function, mapping authenticated user emails against security dimension entitlement tables to restrict data access in real-time. - Tableau User Filters & ISMEMBEROF(): Leverage Tableau Server user groups and calculated field filters to control data visibility across regional departments without creating separate dashboard workbooks.
Diagnosing Dashboard Latency & Visual Bottlenecks
When an executive dashboard takes more than three seconds to render, user adoption plummets. Power BI developers must master the Performance Analyzer tool to isolate whether latency stems from inefficient DAX calculations, visual rendering overload, or underlying DirectQuery database waits. In Tableau, conducting a Performance Recording trace allows you to inspect query compile times and pinpoint visuals that require data aggregation optimization.
Power BI vs Tableau: Frequently Asked Questions
Can I learn both Power BI and Tableau at the same time?
We strongly recommend against learning both simultaneously. Master one tool deeply first. Core analytical competencies—such as Star Schema dimensional modeling, KPI formulation, chart selection, and executive storytelling—transfer seamlessly between platforms. Once you are proficient in Power BI, learning Tableau takes two to three weeks, and vice-versa.
Is Power BI Desktop completely free to use for personal portfolio projects?
Yes. Microsoft Power BI Desktop is 100% free with zero functional limitations. You can ingest millions of rows, write complex DAX measures, and design multi-page reports. You only require a paid license when you need to share interactive dashboards privately within an enterprise organization.
How do I showcase interactive dashboards on my portfolio for free?
For Tableau, you can publish interactive workbooks directly to Tableau Public. For Power BI, you can utilize free hosting community platforms like NovyPro to host live interactive dashboards that recruiters can interact with directly in their web browsers without requiring Microsoft accounts.
Published by the SkillRoadmaps Analytics Strategy Team | Continually Benchmarked Against Enterprise BI Job Postings