
For decades, Microsoft Excel served as the undisputed champion of corporate finance; however, as enterprise transaction volumes scale into millions of ledger entries across ERPs, CRM platforms, and Stripe billing databases, Excel inevitably hits its 1,048,576-row ceiling and crashes under memory pressure. Mastering sql for financial analysts has become the definitive bridge between entry-level spreadsheet modeling and high-compensation Corporate FP&A, Strategic Finance, and Private Equity analytics. In this comprehensive guide, you will master the 10 essential financial SQL queries that CFOs and finance leaders rely upon—from calculating Monthly Recurring Revenue (MRR) and Net Dollar Retention (NDR) to rolling 12-month cash flows, budget variance analysis, and customer acquisition cohorts.
| Analysis Type | Core SQL Mechanism | Business Value to CFO & Leadership |
|---|---|---|
| Monthly Recurring Revenue (MRR) | SUM(CASE WHEN...) with DATE_TRUNC |
Isolates New, Expansion, Contraction & Churned subscription revenue |
| Year-over-Year (YoY) Growth | LAG() OVER (PARTITION BY ... ORDER BY ...) |
Measures seasonal performance variance without calendar distortion |
| Trailing Twelve Months (TTM) | SUM() OVER (ORDER BY ROWS BETWEEN 11 PRECEDING) |
Smooths short-term quarterly volatility for M&A and valuation audits |
| Cohort Retention & NDR | Self-Joins, FIRST_VALUE() & Window Aggregations |
Evaluates customer lifetime expansion and structural churn health |
| Budget vs. Actual Variance | FULL OUTER JOIN with COALESCE |
Highlights departmental overspending and capital allocation leaks |
| Rolling 30-Day Cash Burn | Cumulative Window Frames (BETWEEN UNBOUNDED PRECEDING) |
Determines runway longevity and liquidity risk for treasury operations |
The Paradigm Shift: Why Financial Analysts Must Code SQL
In modern data-driven enterprises, financial data does not live in tidy spreadsheet files; it lives in cloud enterprise data warehouses like Snowflake, Google BigQuery, Amazon Redshift, and PostgreSQL. When a financial analyst relies solely on CSV exports provided by busy data engineering teams, critical variance analyses are delayed by days or weeks.

Figure 1: The Modern Financial Analytics Pipeline from raw ERP General Ledger transactions to executive board reporting.
Eliminating VLOOKUP Fragility and Data Latency
Unlike fragile Excel spreadsheets where an accidentally deleted formula row corrupts an entire financial forecast, SQL queries provide reproducible, audit-compliant data pipelines. A single well-written SQL query can parse 50 million transaction lines in under 3 seconds, perform currency conversions, aggregate across business subsidiaries, and output clean datasets directly into Business Intelligence dashboards.
According to research from corporate finance compensation benchmarks and the CFA Institute, financial analysts proficient in relational database querying command 18% to 25% higher median compensation than peers limited strictly to traditional spreadsheet workflows. Plan your strategic career transition with our Career Roadmap Planner and evaluate salary upside with our Tech Salary & Bootcamp ROI Calculator.
The 10 Practical Financial SQL Queries Every Analyst Must Master
Query 1: Monthly Recurring Revenue (MRR) Waterfall Breakdown
In recurring revenue and SaaS business models, top-line MRR changes every month through four distinct dynamics: New MRR (new customers), Expansion MRR (upgrades), Contraction MRR (downgrades), and Churn MRR (cancellations). This query computes the exact monthly waterfall:
WITH monthly_customer_revenue AS (
    SELECT
        DATE_TRUNC('month', transaction_date) AS rev_month,
        customer_id,
        SUM(amount) AS current_mrr
    FROM subscriptions_ledger
    GROUP BY 1, 2
),
mrr_with_previous AS (
    SELECT
        rev_month,
        customer_id,
        current_mrr,
        LAG(current_mrr, 1, 0.0) OVER (
            PARTITION BY customer_id
            ORDER BY rev_month
        ) AS previous_mrr
    FROM monthly_customer_revenue
)
SELECT
    rev_month,
    SUM(CASE WHEN previous_mrr = 0 AND current_mrr > 0 THEN current_mrr ELSE 0 END) AS new_mrr,
    SUM(CASE WHEN previous_mrr > 0 AND current_mrr > previous_mrr THEN (current_mrr - previous_mrr) ELSE 0 END) AS expansion_mrr,
    SUM(CASE WHEN current_mrr > 0 AND current_mrr < previous_mrr THEN (previous_mrr - current_mrr) ELSE 0 END) AS contraction_mrr,
    SUM(CASE WHEN current_mrr = 0 AND previous_mrr > 0 THEN previous_mrr ELSE 0 END) AS churn_mrr,
    SUM(current_mrr) AS total_closing_mrr
FROM mrr_with_previous
GROUP BY 1
ORDER BY 1 DESC;
For financial modelers integrating these metrics into formal three-statement models, review our step-by-step Financial Modeling Roadmap: Complete Step-by-Step Curriculum.
Query 2: Year-over-Year (YoY) Revenue Growth Percentage
Seasonality can severely distort month-over-month comparisons. Comparing each month against the exact same calendar month from the preceding fiscal year eliminates seasonal bias:
WITH monthly_totals AS (
    SELECT
        DATE_TRUNC('month', invoice_date) AS sales_month,
        SUM(net_revenue) AS monthly_revenue
    FROM general_ledger_sales
    GROUP BY 1
)
SELECT
    sales_month,
    monthly_revenue,
    LAG(monthly_revenue, 12) OVER (ORDER BY sales_month) AS py_same_month_revenue,
    ROUND(
        ((monthly_revenue - LAG(monthly_revenue, 12) OVER (ORDER BY sales_month))
        / NULLIF(LAG(monthly_revenue, 12) OVER (ORDER BY sales_month), 0)) * 100.0,
        2
    ) AS yoy_growth_percentage
FROM monthly_totals
ORDER BY sales_month DESC;
Query 3: Trailing Twelve Months (TTM) Revenue Calculation
Private equity sponsors and valuation auditors analyze Trailing Twelve Months (TTM) figures to determine normalized EBITDA multiples without quarterly swings. SQL’s sliding window frame computes this dynamically:
SELECT
    report_month,
    monthly_revenue,
    SUM(monthly_revenue) OVER (
        ORDER BY report_month
        ROWS BETWEEN 11 PRECEDING AND CURRENT ROW
    ) AS ttm_revenue,
    AVG(monthly_revenue) OVER (
        ORDER BY report_month
        ROWS BETWEEN 11 PRECEDING AND CURRENT ROW
    ) AS ttm_monthly_average
FROM monthly_financial_summary
ORDER BY report_month DESC;
Query 4: Customer Acquisition Cohort Retention & Net Dollar Retention (NDR)
Net Dollar Retention reveals whether an enterprise software business can grow organically even if it stops acquiring new customers entirely. If NDR exceeds 100%, customer expansion exceeds customer churn.
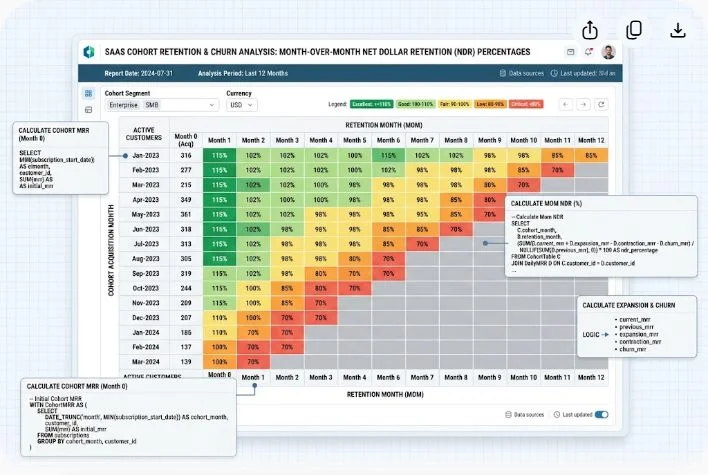
Figure 2: SaaS Cohort Retention and Net Dollar Retention (NDR) matrix tracking revenue trajectories across acquisition vintages.
WITH first_purchase AS (
    SELECT
        customer_id,
        DATE_TRUNC('month', MIN(order_date)) AS cohort_month,
        SUM(amount) AS cohort_initial_revenue
    FROM customer_orders
    GROUP BY 1
),
order_activity AS (
    SELECT
        o.customer_id,
        f.cohort_month,
        DATE_TRUNC('month', o.order_date) AS activity_month,
        SUM(o.amount) AS current_period_revenue
    FROM customer_orders o
    JOIN first_purchase f ON o.customer_id = f.customer_id
    GROUP BY 1, 2, 3
)
SELECT
    cohort_month,
    activity_month,
    -- Months elapsed since initial acquisition
    (EXTRACT(YEAR FROM activity_month) - EXTRACT(YEAR FROM cohort_month)) * 12 +
    (EXTRACT(MONTH FROM activity_month) - EXTRACT(MONTH FROM cohort_month)) AS period_number,
    SUM(current_period_revenue) AS active_cohort_revenue,
    ROUND(
        (SUM(current_period_revenue) /
         NULLIF(MAX(cohort_initial_revenue), 0)) * 100.0,
        2
    ) AS net_dollar_retention_rate
FROM order_activity
GROUP BY 1, 2
ORDER BY 1, 3;
Mastering these advanced multi-table CTEs is critical for technical financial interviews. Practice additional query patterns in our SQL Interview Cheat Sheet: 20 Common Query Patterns for Tech Roles.
Query 5: Budget vs. Actual Departmental Variance Analysis
FP&A teams must reconcile actual accounting expenses against approved departmental operating budgets. Using a FULL OUTER JOIN ensures that unbudgeted rogue expenses or departments with zero actual spending are never omitted:
SELECT
    COALESCE(a.dept_code, b.dept_code) AS department_code,
    COALESCE(a.period_month, b.period_month) AS fiscal_month,
    COALESCE(b.budgeted_amount, 0.0) AS budget_allocation,
    COALESCE(a.actual_amount, 0.0) AS actual_spend,
    (COALESCE(a.actual_amount, 0.0) - COALESCE(b.budgeted_amount, 0.0)) AS variance_dollar,
    ROUND(
        ((COALESCE(a.actual_amount, 0.0) - COALESCE(b.budgeted_amount, 0.0))
        / NULLIF(b.budgeted_amount, 0.0)) * 100.0,
        2
    ) AS variance_pct
FROM (
    SELECT dept_code, period_month, SUM(amount) AS actual_amount
    FROM general_ledger_actuals
    GROUP BY 1, 2
) a
FULL OUTER JOIN (
    SELECT dept_code, period_month, SUM(budget_limit) AS budgeted_amount
    FROM corporate_budgets
    GROUP BY 1, 2
) b
ON a.dept_code = b.dept_code AND a.period_month = b.period_month
ORDER BY variance_dollar DESC;
For analysts preparing for finance department roles, dive deep into workflows with our FP&A Analyst Career Guide: Core Skills, Salaries & Daily Workflow.
Query 6: Cumulative Running Cash Balance and Burn Rate
Treasury teams calculate running cash balances to project runaway limits. A cumulative unbounded window function calculates the exact daily liquidity posture:
SELECT
    entry_date,
    net_daily_cash_flow,
    SUM(net_daily_cash_flow) OVER (
        ORDER BY entry_date
        ROWS BETWEEN UNBOUNDED PRECEDING AND CURRENT ROW
    ) AS cumulative_cash_balance,
    AVG(net_daily_cash_flow) OVER (
        ORDER BY entry_date
        ROWS BETWEEN 29 PRECEDING AND CURRENT ROW
    ) AS rolling_30day_avg_burn_rate
FROM treasury_cash_entries
ORDER BY entry_date ASC;
Query 7: Accounts Receivable (AR) Aging Buckets (30, 60, 90+ Days)
Credit risk management requires bucketing outstanding customer invoices into overdue risk categories to forecast bad debt provisions:
SELECT
    client_name,
    invoice_id,
    outstanding_balance,
    CURRENT_DATE - due_date AS days_past_due,
    CASE
        WHEN CURRENT_DATE <= due_date THEN 'Current / Not Due'
        WHEN CURRENT_DATE - due_date BETWEEN 1 AND 30 THEN '1 - 30 Days Overdue'
        WHEN CURRENT_DATE - due_date BETWEEN 31 AND 60 THEN '31 - 60 Days Overdue'
        WHEN CURRENT_DATE - due_date BETWEEN 61 AND 90 THEN '61 - 90 Days Overdue'
        ELSE '90+ Days Delinquent'
    END AS aging_bucket
FROM invoices_open_ledger
WHERE outstanding_balance > 0
ORDER BY days_past_due DESC;
Query 8: Pareto Principle Analysis (Top 20% Customers Generating 80% Revenue)
Using cumulative percentage window functions allows analysts to evaluate customer concentration risk:
WITH ranked_customers AS (
    SELECT
        customer_id,
        SUM(revenue) AS total_revenue,
        ROW_NUMBER() OVER (ORDER BY SUM(revenue) DESC) AS customer_rank,
        COUNT(*) OVER () AS total_customer_count
    FROM sales_records
    GROUP BY 1
),
cumulative_revenue AS (
    SELECT
        customer_id,
        total_revenue,
        customer_rank,
        total_customer_count,
        SUM(total_revenue) OVER (ORDER BY total_revenue DESC) AS running_revenue_sum,
        SUM(total_revenue) OVER () AS global_revenue_sum
    FROM ranked_customers
)
SELECT
    customer_id,
    total_revenue,
    ROUND((customer_rank::numeric / total_customer_count) * 100.0, 2) AS customer_percentile,
    ROUND((running_revenue_sum / global_revenue_sum) * 100.0, 2) AS cumulative_revenue_share_pct
FROM cumulative_revenue
WHERE (running_revenue_sum / global_revenue_sum) <= 0.80;
Query 9: Month-to-Date (MTD) vs. Same-Day Prior Month Pacing
Executive teams demand daily revenue pacing updates to determine if sales quotas will be achieved before month-end:
WITH daily_sales AS (
    SELECT
        transaction_date,
        DATE_TRUNC('month', transaction_date) AS sales_month,
        EXTRACT(DAY FROM transaction_date) AS day_of_month,
        SUM(amount) AS daily_rev
    FROM corporate_sales
    GROUP BY 1, 2, 3
)
SELECT
    transaction_date,
    sales_month,
    day_of_month,
    daily_rev,
    SUM(daily_rev) OVER (
        PARTITION BY sales_month
        ORDER BY day_of_month
        ROWS BETWEEN UNBOUNDED PRECEDING AND CURRENT ROW
    ) AS mtd_cumulative_revenue
FROM daily_sales
ORDER BY transaction_date DESC;
Query 10: Gross Margin by Product Category with Dynamic Contribution Ranking
Understanding which product lines produce the highest gross profit margin enables leadership to optimize inventory capital allocation:
SELECT
    product_category,
    SUM(revenue) AS gross_revenue,
    SUM(cogs) AS cost_of_goods_sold,
    SUM(revenue) - SUM(cogs) AS gross_profit,
    ROUND(((SUM(revenue) - SUM(cogs)) / NULLIF(SUM(revenue), 0)) * 100.0, 2) AS gross_margin_pct,
    DENSE_RANK() OVER (ORDER BY (SUM(revenue) - SUM(cogs)) DESC) AS profitability_rank
FROM product_line_ledger
GROUP BY 1
ORDER BY gross_profit DESC;
Building a Standout Financial Analytics Portfolio
Recruiters at leading hedge funds, tech firms, and investment banks prioritize candidates with proven GitHub portfolios that demonstrate clean SQL scripting connected to Business Intelligence reporting. If you need portfolio inspiration, generate tailored project blueprints with our free Portfolio Project Generator.
Consider building an end-to-end repository that connects PostgreSQL transaction queries directly to interactive dashboards. For interview strategy, prepare for behavioral screenings with our guide on Data Analyst Behavioral Interview Questions: The Complete STAR Method.
Frequently Asked Questions About SQL for Finance
Is SQL hard for financial analysts to learn if they only know Excel?
No. Financial analysts who understand Excel concepts like SUMIFS, INDEX/MATCH, VLOOKUP, and Pivot Tables usually learn SQL within 3 to 4 weeks because the mental logic of tabular manipulation is nearly identical. A GROUP BY is equivalent to an Excel Pivot Table, while a LEFT JOIN replaces VLOOKUP.
Which SQL dialect should financial analysts focus on first?
PostgreSQL is the recommended standard dialect to learn first because of its strict compliance with ANSI SQL standards and its widespread adoption across cloud data warehouses like Amazon Redshift and Snowflake. The syntax you master in PostgreSQL transfers directly to Snowflake, BigQuery, and Databricks SQL.
Can SQL replace Excel completely in corporate finance?
No. SQL and Excel serve complementary functions. SQL extracts, aggregates, and validates millions of transaction rows from corporate databases into clean summary tables. Excel remains the premier tool for flexible qualitative financial modeling, scenario sensitivities, and ad-hoc presentation charts.
What is the most important SQL function for financial modeling?
Window functions—specifically LAG(), LEAD(), and cumulative SUM() OVER (...) frames. These functions allow analysts to calculate month-over-month growth, cohort retention, and rolling twelve-month moving totals without writing computationally expensive self-joins.
How do I test my SQL queries if I don't have access to production company databases?
You can install PostgreSQL locally or use free sandbox environments like SQLite or DuckDB. You can load free public financial datasets from SEC EDGAR, Kaggle, or Yahoo Finance to practice building financial queries and dashboards on real historical transaction records.
Published by the SkillRoadmaps Editorial Team | Updated for 2026 Corporate Finance & FP&A Standards