
In traditional accounting regimes governed by GAAP and IFRS, financial performance is evaluated through historical accrual statements: Income Statements, Balance Sheets, and Cash Flow summaries. However, for Software-as-a-Service (SaaS) and cloud subscription enterprises, traditional accounting statements fail to capture the underlying unit economics of the business. In SaaS, a company incurs heavy sales, marketing, and onboarding expenses upfront to acquire a subscriber, but collects revenue in recurring monthly or annual installments over a multi-year customer lifespan.
Consequently, evaluating a subscription business requires a specialized suite of non-GAAP operational and financial metrics. Whether you are an FP&A financial analyst building quarterly investor models, a product manager prioritizing feature retention, or an executive presenting to venture capital investors, understanding how ARR, CAC, LTV, Net Revenue Retention (NRR), and the Rule of 40 interact is essential. Plan your career growth with our Career Roadmap Planner, or evaluate compensation upside in our FP&A Analyst Career Guide.
| SaaS Metric | Mathematical Formula | Healthy Venture Benchmark | Primary Business Risk Signaled |
|---|---|---|---|
| Annual Recurring Revenue (ARR) | MRR times 12 (Contracted subscription run-rate) | Consistent 30%+ YoY growth | Stagnant pipeline; reliance on non-recurring professional services |
| Net Revenue Retention (NRR) | (Ending ARR from Existing Base / Starting ARR from Same Base) * 100 | Enterprise: >115%–125%; SMB: >100% | Product-market decay, poor onboarding, or aggressive competitor poaching |
| Customer Acquisition Cost (CAC) | Total Sales & Marketing Expenses / Number of New Customers Acquired | Payback period < 12–14 months | Inefficient sales channels, bloated ad spend, or low sales rep quota attainment |
| LTV:CAC Ratio | Customer Lifetime Value / Customer Acquisition Cost | 3.0x to 4.0x (The Gold Standard) | <1.0x: Insolvent unit economics; >5.0x: Under-investing in growth |
| The Rule of 40 | YoY Revenue Growth Rate (%) + Free Cash Flow Margin (%) | ≥ 40% combined score | Uncontrolled cash burn without compensating top-line expansion |
The ARR Revenue Waterfall: Mechanics of Recurring Growth
Unlike transactional businesses that reset sales to zero at the start of every fiscal month, a SaaS business begins every period with an established baseline of recurring revenue. Tracking changes across this baseline requires the ARR Waterfall.
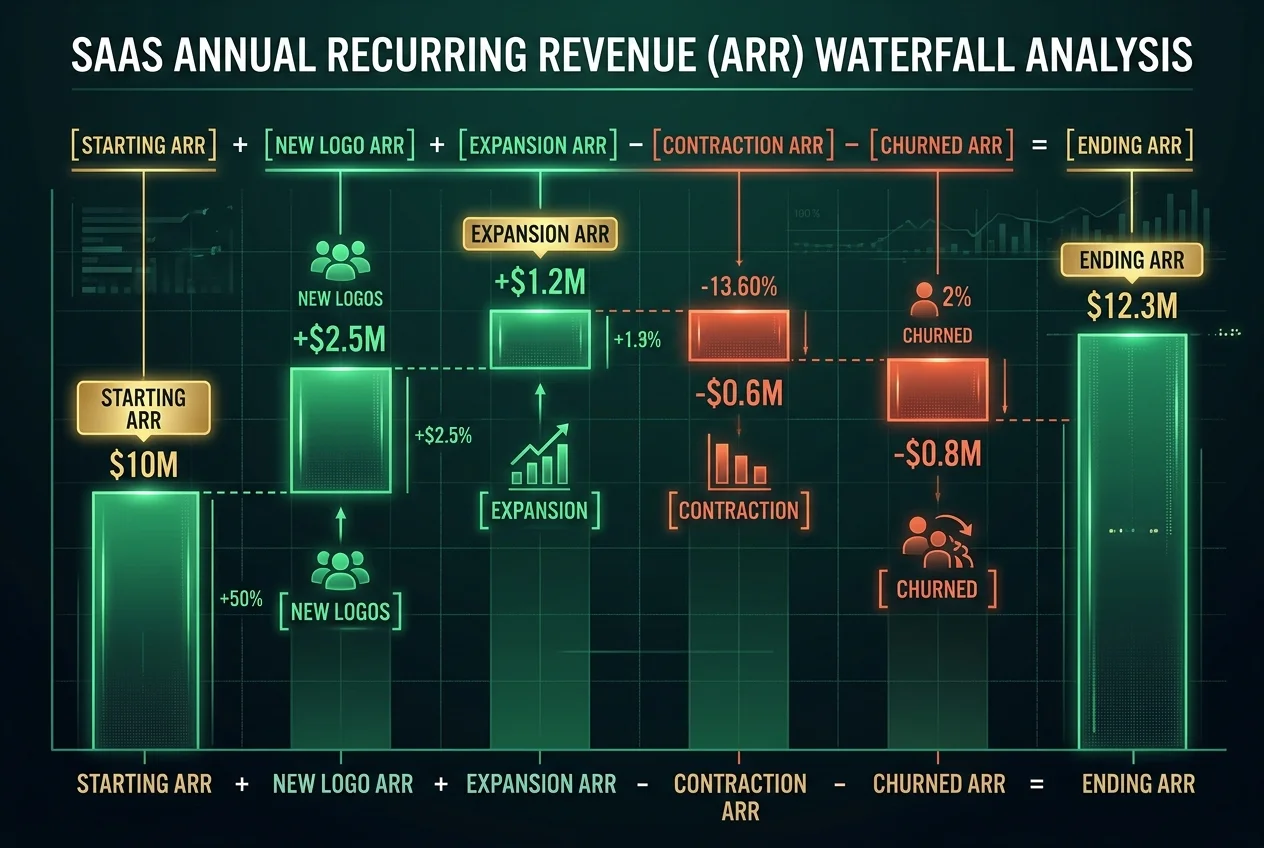
The Five Components of the ARR Waterfall
Ending ARR = Beginning ARR
           + New Logo ARR (Revenue from brand-new customers)
           + Expansion ARR (Upsells, additional seat licenses, cross-sell modules)
           - Contraction ARR (Downgrades to lower tiers or reduced user seats)
           - Churned ARR (Complete customer cancellations)
Tracking these subcomponents separately is vital. A company might report healthy 25% headline ARR growth, but if that growth is fueled by aggressive marketing masking a 30% annual churn rate, the business is pouring capital into a “leaky bucket” that will collapse as customer acquisition costs rise.
Net Revenue Retention (NRR): The Engine of Enterprise Valuation
Venture capitalists and public markets value enterprise SaaS companies primarily based on their Net Revenue Retention (NRR). NRR measures the percentage of recurring revenue retained from existing customers over a 12-month period, accounting for expansion, contraction, and churn, while completely excluding new customers acquired during the year.
The Power of Negative Net Churn
When an enterprise achieves an NRR exceeding 100% (e.g., Snowflake at 127% or Datadog at 115%), the company exhibits Negative Net Churn. This means that even if the sales team closed zero new accounts for an entire year, total company revenue would still expand purely from existing clients purchasing more capacity, user licenses, and premium features.
Unit Economics: The LTV:CAC Ratio & Payback Period
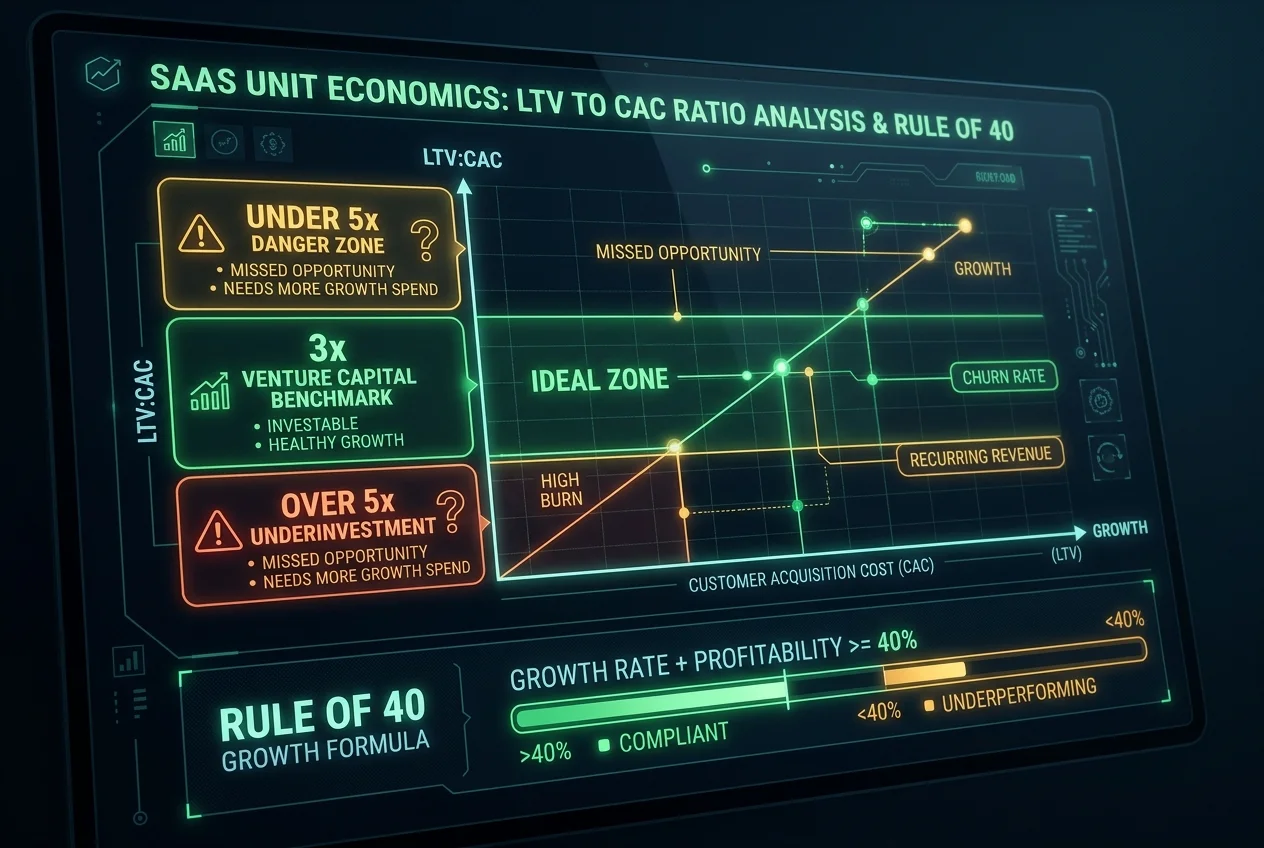
Scaling a SaaS company profitably demands maintaining rigorous unit economics. You must know exactly how much gross profit a customer generates over their lifespan relative to what you spent to acquire them.
Calculating Customer Lifetime Value (LTV)
Never calculate LTV using top-line revenue alone. LTV must be evaluated on Gross Margin to account for the hosting and customer support costs required to service the subscription:
LTV = (Average Annual Revenue Per Account [ARPA] * Gross Margin %) / Annual Gross Revenue Churn Rate %
The Three Benchmarking Zones for LTV:CAC
- Under 1.0x (Value Destruction): The company loses money on every customer acquired. Cash reserves burn rapidly unless marketing channels are completely restructured.
- 3.0x to 4.0x (The Optimal Growth Band): The enterprise benchmark indicating exceptional capital efficiency. Sales investments yield predictable, multi-year compounding profits.
- Over 5.0x (Underinvestment Risk): While superficially appealing, a ratio above 5x indicates the company is being overly conservative. Competitors with lower margin hurdles will out-spend and capture broader market share.
CAC Payback Period: The Capital Liquidity Barometer
While LTV:CAC evaluates long-term customer profitability over 3 to 5 years, the CAC Payback Period measures immediate cash flow sustainability: exactly how many months it takes for a customer’s gross profit contribution to fully recover the sales and marketing dollars spent acquiring them.
CAC Payback (Months) = (CAC) / (Average Monthly Recurring Revenue per Account * Gross Margin %)
In modern venture markets, an enterprise CAC Payback under 12 to 14 months is considered elite. Payback periods extending beyond 24 months strain corporate working capital and require excessive external debt or dilutive equity financing to sustain growth.
Cohort Retention Analysis & The Magic Number
Advanced financial modeling in SaaS requires cohort analysis: grouping customers by their initial month or quarter of acquisition and plotting their revenue retention trajectories over time. In a healthy SaaS business, cohort revenue curves flatten after 6 to 12 months, forming a stable “smile curve” where expansion from power users outpaces cancellations.
Furthermore, finance executives evaluate go-to-market productivity using The SaaS Magic Number:
SaaS Magic Number = [(Quarter N Net New ARR) * 4] / (Quarter N-1 Sales & Marketing Expense)
- Magic Number < 0.5: Go-to-market engine is broken; sales efficiency is inadequate to justify pouring additional capital into paid channels.
- Magic Number 0.75 – 1.0: Healthy sales efficiency; customer acquisition engine is primed to scale.
- Magic Number > 1.0: Hyper-efficient acquisition; management should aggressively accelerate sales hiring and marketing expenditure.
Frequently Asked Questions (FAQ)
What is the difference between ARR and GAAP Revenue in SaaS?
ARR represents the annualized run-rate of contracted recurring subscriptions, whereas GAAP revenue measures recognized historical revenue based on service delivery over time under ASC 606 rules.
Why is Net Revenue Retention (NRR) more important than gross churn?
NRR accounts for account expansion and upsells alongside churn. A company with high NRR (>115%) can maintain rapid growth even with modest churn because surviving accounts spend progressively more each year.
What is a good Rule of 40 score for early-stage SaaS?
A score of 40% or higher is considered healthy. High-growth startups may achieve this with 60% revenue growth and negative 20% free cash flow margin, while mature SaaS firms might deliver 15% growth and 25% cash flow margin.
How does subscription gross margin affect CAC payback period?
Higher gross margins accelerate CAC payback. Because payback is calculated using gross profit rather than raw revenue, a company with 80% margins recovers sales spend significantly faster than one with 60% margins.