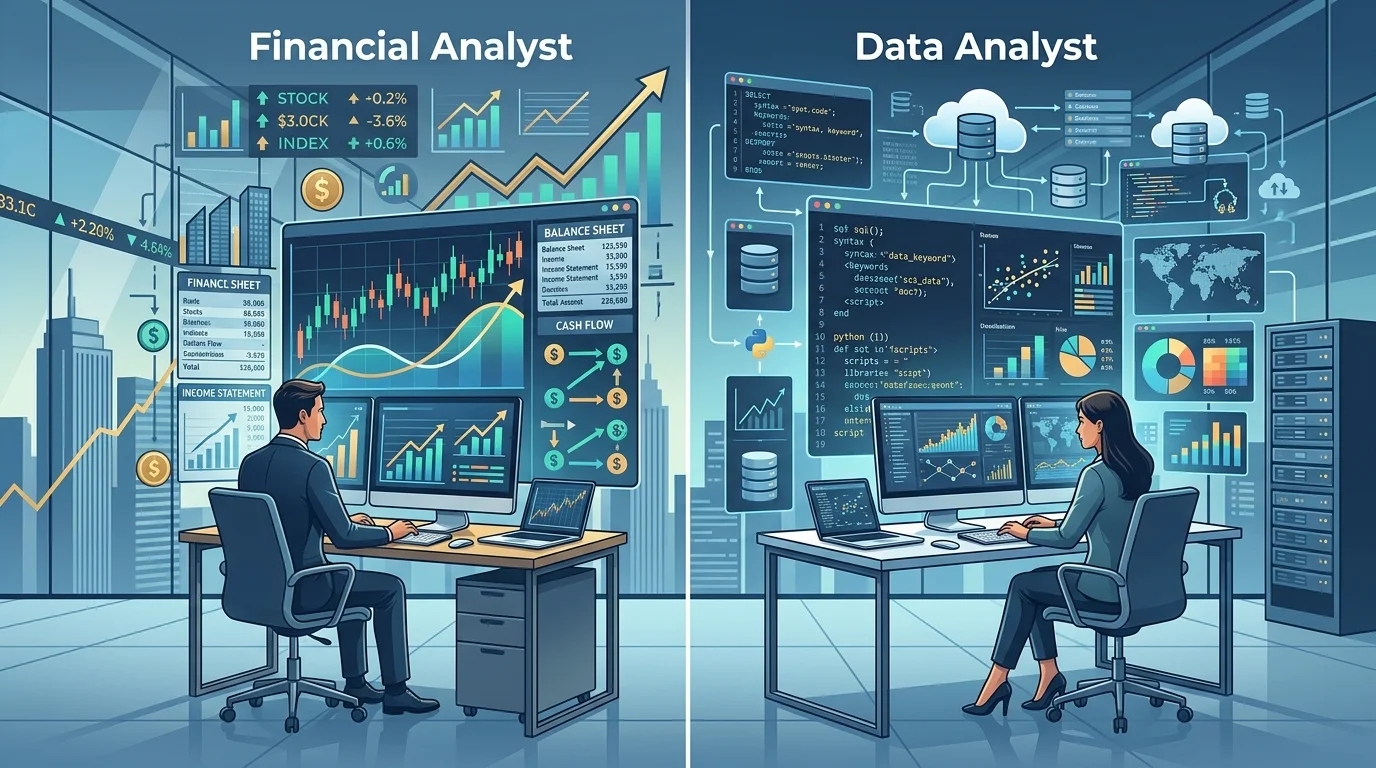
When weighing financial analyst vs data analyst career trajectories in today’s data-intensive corporate landscape, professionals often find themselves comparing two of the most lucrative and rewarding analytical paths. Choosing between becoming a Financial Analyst and a Data Analyst is one of the most common dilemmas faced by analytical problem-solvers, business majors, and career changers. Both professions revolve around dissecting numbers, finding patterns, and steering high-stakes corporate decisions. However, the lenses through which they view data, the technical toolkits they rely on daily, and their long-term earning trajectories diverge significantly. For verified technical documentation and standards, refer to CFA Institute Global Standards.
While a financial analyst spends their mornings evaluating company earnings, building discounted cash flow (DCF) models, and assessing market risk in Microsoft Excel, a data analyst is writing SQL queries against cloud data warehouses, automating pipelines in Python, and crafting interactive dashboards in Power BI or Tableau to uncover user behavior trends.
If you are trying to determine which path best matches your natural strengths, work preferences, and income ambitions, this comprehensive guide provides an unbiased, end-to-end breakdown. We analyze day-to-day responsibilities, core skills, compensation across career tiers, transition possibilities, and concrete steps to launch your journey.
Quick Summary: Financial Analyst vs Data Analyst
| Feature / Metric | Financial Analyst | Data Analyst |
|---|---|---|
| Primary Focus | Corporate finance, budgeting, forecasting, financial health, and investment valuation. | Operational data, user behavior, product metrics, and business intelligence. |
| Primary Tools | Microsoft Excel, Financial Modeling, SAP/Oracle ERP, Bloomberg Terminal, PowerPoint. | SQL, Python, R, Power BI, Tableau, Snowflake, BigQuery, Excel. |
| Core Educational Background | Finance, Accounting, Economics, Business Administration, CFA. | Computer Science, Statistics, Information Systems, STEM, or self-taught bootcamps. |
| Entry-Level Salary (US Avg) | $68,000 – $76,000 / year | $72,000 – $82,000 / year |
| Senior-Level Salary (US Avg) | $115,000 – $155,000+ / year | $125,000 – $160,000+ / year |
| Industry Flexibility | Concentrated in banking, investment firms, corporate finance (FP&A), and insurance. | Universal across all sectors (tech, healthcare, e-commerce, sports, manufacturing, finance). |
| Coding Requirement | Low to Optional (basic VBA or basic Python/SQL in modern roles). | Mandatory (intermediate-to-advanced SQL and foundational Python/R). |
Curious how these compensation bands translate to your local currency or how fast an educational program pays for itself? Check out our free Tech Salary & Bootcamp ROI Calculator to calculate take-home pay, payback timelines, and compensation curves across tech and finance careers.
Financial Analyst vs Data Analyst: What Financial Analysts Actually Do
Financial analysts are responsible for examining historical financial data, understanding economic market conditions, and creating forward-looking forecasts to guide an organization’s capital allocation. They translate accounting data from balance sheets, income statements, and cash flow reports into strategic recommendations for leadership, investors, or clients.
In corporate settings, financial analysts typically operate within Financial Planning & Analysis (FP&A) teams. Their day involves tracking budget versus actual performance, building quarterly forecasts, and advising departmental managers on cost optimization. In investment banking or asset management, financial analysts conduct equity research, build merger-and-acquisition (M&A) models, and calculate company valuations.
Typical Daily Responsibilities: Financial Analyst vs Data Analyst
Understanding a typical workday highlights key practical distinctions in financial analyst vs data analyst career choices.
- Financial Modeling: Constructing dynamic three-statement models, DCF valuations, sensitivity analyses, and capital expenditure forecasts in Excel.
- Variance Analysis: Comparing actual monthly revenue and department expenses against projected budgets to pinpoint operational discrepancies.
- Executive Reporting: Preparing polished slide decks and financial briefs for Chief Financial Officers (CFOs), board members, and department heads.
- Market & Industry Research: Monitoring macroeconomic trends, interest rate shifts, competitor earnings reports, and regulatory developments.
- Capital Budgeting: Evaluating proposed projects or acquisitions using Net Present Value (NPV) and Internal Rate of Return (IRR) metrics.
Financial Analyst vs Data Analyst: What Data Analysts Actually Do
Data analysts serve as translators between raw technical data and practical business execution. While financial analysts look primarily at money flows, data analysts look at almost every type of digital footprint an organization generates: website clickstreams, customer support tickets, supply chain delivery logs, mobile app churn rates, and advertising campaign metrics.
Data analysts clean messy databases, write complex SQL queries to extract relevant records from cloud data warehouses like Snowflake or BigQuery, and build automated visualization dashboards that monitor business health in real time. Rather than asking “How does this impact our quarterly balance sheet?”, a data analyst asks “Why did user churn spike by 14% after our last feature release, and what specific cohort is driving the loss?”
Data Operations Daily Workflow: Financial Analyst vs Data Analyst
Examining daily analytical tasks further clarifies the operational boundaries of financial analyst vs data analyst roles.
- Database Querying (SQL): Writing multi-table joins, subqueries, and window functions to extract metrics from millions of database records.
- Data Cleaning & Wrangling: Resolving missing values, deduplicating records, parsing timestamps, and normalizing messy data in Python or Excel.
- Dashboard Architecture: Designing interactive, user-friendly reports in Power BI or Tableau that update automatically for non-technical stakeholders.
- Exploratory Data Analysis (EDA): Detecting anomalies, correlations, and hidden behavioral patterns using statistical libraries like Pandas, NumPy, and Seaborn.
- Experimentation & A/B Testing: Evaluating whether marketing variants or UI product changes produced statistically significant revenue or conversion improvements.
If you’re eager to see the comprehensive roadmap for developing data analytics competencies from scratch, explore our detailed Data Analyst Roadmap 2026.
Financial Analyst vs Data Analyst: Technical Skills & Software Overlap
While their tools diverge, financial analysts and data analysts share a foundational core: both must possess sharp quantitative intuition, rigorous logic, and the ability to persuade skeptical decision-makers through clear visual storytelling.

1. Microsoft Excel: The Universal Foundation
Both disciplines demand complete fluency in Excel, but they leverage different feature sets. Financial analysts treat Excel as their primary operating system. They rely heavily on financial modeling formulas (XNPV, XIRR, OFFSET, INDEX/MATCH), scenario managers, and nested logical statements. They frequently navigate entirely via keyboard shortcuts without touching a mouse.
Data analysts, on the other hand, utilize Excel primarily for quick exploratory audits, ad-hoc data cleaning, and rapid Pivot Table prototyping. Once a dataset exceeds several hundred thousand rows, data analysts immediately graduate to SQL and Python.
2. Programming & Database Querying: SQL and Python
This is where the sharpest technical dividing line occurs. SQL is non-negotiable for modern data analysts; if you cannot write efficient queries with Common Table Expressions (CTEs) and window functions, you cannot fulfill the responsibilities of the role. Python or R is also standard for automated data ingestion, statistical modeling, and advanced visualization.
In contrast, traditional financial analysts rarely touch SQL or Python. Most rely on ERP reporting interfaces (such as SAP, NetSuite, or Workday) or specialized plugins that export data directly into Excel. However, “Quantitative Financial Analysts” and modern FinTech professionals are increasingly adopting Python to automate repetitive financial reporting.
3. Business Intelligence & Visualization Tools
Data analysts specialize in automated BI tools like Microsoft Power BI, Tableau, and Looker. They build star-schema data models, author DAX calculations, and create live dashboards accessed by hundreds of corporate users. If you are deciding which BI tool to tackle first, check our definitive comparison: Power BI vs Tableau: Which to Learn First?.
Financial analysts generally present their findings through standardized financial tables, executive summaries, and PowerPoint presentations. While Power BI is gaining traction in modern FP&A teams, it remains secondary to spreadsheet presentations in executive boardrooms.
Salary Comparison and Career Trajectories
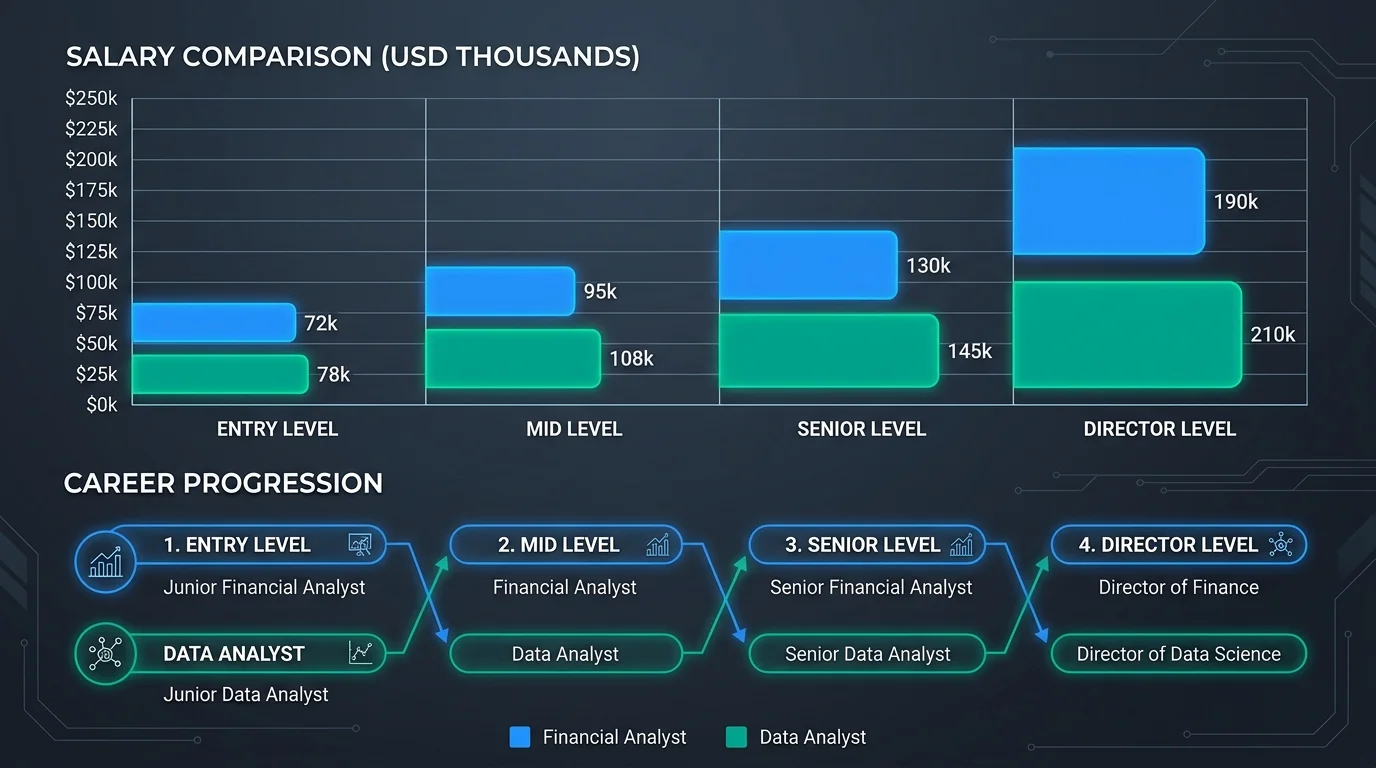
Compensation in both careers is robust, consistently outpacing general corporate averages. However, their salary ceilings and compensation structures differ based on industry vertical and technical specialization.
Entry-Level Comparison (0 – 2 Years Experience)
At the entry level, Data Analysts frequently enjoy a slight compensation edge due to the technical barrier of SQL and programming. Entry-level data analysts in the United States command average base salaries between $72,000 and $82,000, with tech hubs offering $85,000 to $95,000.
Junior Financial Analysts in general corporate FP&A start between $68,000 and $76,000. However, there is one major exception: entry-level analysts at bulge-bracket investment banks (Goldman Sachs, Morgan Stanley, J.P. Morgan) can earn total compensation of $110,000 to $140,000+, though this comes with demanding 70-to-85-hour workweeks.
Mid-Level Progression (3 – 5 Years Experience)
As professionals attain 3 to 5 years of verified experience, compensation expands significantly across both trajectories:
- Financial Analysts (Mid-Level): Average base salaries range from $90,000 to $105,000, typically augmented by 10% to 20% annual performance bonuses.
- Data Analysts (Mid-Level): Base compensation ranges between $100,000 and $115,000, frequently supplemented with equity grants (RSUs) in technology firms.
Senior & Leadership Ceiling (6+ Years Experience)
At senior and director tiers, the career trajectories take very different strategic paths:
- Finance Leadership Path: Senior Financial Analyst ($120k – $145k) → FP&A Manager ($140k – $170k) → Director of Finance ($180k – $240k+) → Vice President of Finance / Chief Financial Officer (CFO). Finance leadership paths offer exceptional equity upside, executive influence, and direct pathways to the C-suite.
- Analytics Leadership Path: Senior Data Analyst ($130k – $165k) → Lead Analytics Engineer / Analytics Manager ($160k – $195k) → Director of Business Intelligence / Data Science ($200k – $260k+) → Head of Data / Chief Data Officer (CDO). High-performing data analysts can also pivot smoothly into Data Engineering or Product Management.
To design a personalized milestone timeline that aligns with your current target role, use our interactive Career Roadmap Planner to generate your custom week-by-week transition blueprint.
Work-Life Balance & Daily Culture
Workplace culture represents one of the most substantial day-to-day contrasts between these two professions:
The Financial Analyst Work Rhythm
Corporate financial analysis follows a cyclical, calendar-driven rhythm. During monthly, quarterly, and year-end accounting closes, workloads intensify substantially. Analysts frequently work late nights ensuring that financial statements reconcile down to the cent. Outside of quarterly reporting cycles and annual budget season (typically Q4), hours are generally stable at 40 to 45 hours per week.
In high-finance environments like investment banking or private equity, work-life balance is notoriously grueling, with 65 to 85 hours per week considered the baseline standard.
The Data Analyst Work Rhythm
Data analytics operates under sprint-based project workflows commonly borrowed from Agile software development. Analysts work with product managers, marketing leads, and software engineers in two-week sprints. The pressure is more continuous but rarely involves the brutal 80-hour spikes seen in Wall Street finance.
Furthermore, because data analytics is rooted in software engineering practices, remote and hybrid work opportunities are substantially more plentiful for data analysts than for traditional finance teams, which often maintain in-office corporate cultures.
Can You Transition from Financial Analyst to Data Analyst (or Vice Versa)?
Yes. In fact, professionals who successfully bridge the gap between finance and technical data analytics are among the most sought-after and highly compensated specialists in the modern job market.
Transitioning from Finance to Data Analytics
If you already possess a financial background, you hold a massive competitive advantage: business acumen. While many junior computer science graduates struggle to understand how revenue models, customer margins, and operating expenses function, you already understand the financial mechanics of an enterprise.
To execute the pivot into data analytics, your primary objective is closing the technical gap:
- Master SQL: Dedicate 30 days to database querying. Learn joins, group by aggregation, CTEs, and window functions using our free How to Learn SQL in 30 Days Study Plan.
- Adopt a Modern BI Tool: Build 2 to 3 portfolio dashboards in Power BI or Tableau demonstrating financial KPIs (such as SaaS metrics, churn analysis, or revenue forecasting).
- Learn Python Fundamentals: Learn Pandas and NumPy to automate the repetitive Excel data manipulation you currently do manually.
Need portfolio inspiration to show hiring managers what you can build? Generate realistic project ideas tailored to your background with our free Portfolio Project Generator.
Transitioning from Data Analytics to Finance
If you are a data analyst seeking to move into corporate finance or FP&A, your technical data extraction and automation capabilities are already superior to most finance teams. Your challenge will be mastering accounting principles.
Focus on understanding the three primary financial statements (Balance Sheet, Income Statement, Cash Flow Statement) and how transactions flow through double-entry accounting. Earning certifications like the Corporate Finance Institute’s Financial Modeling & Valuation Analyst (FMVA) or studying for the CFA Level 1 will immediately validate your financial literacy to employers.
Which Career Should You Choose in 2026?
To make the ultimate decision, reflect on which set of statements resonates more deeply with your daily interests and cognitive style:
Choose Financial Analyst if:
- You have a genuine fascination with financial markets, macroeconomic trends, stock valuations, and corporate deal-making.
- You enjoy answering “What will our company’s profitability look like over the next 12 to 36 months under various economic scenarios?”
- You thrive in structured corporate environments and aspire to executive financial leadership (such as CFO or VP of Finance).
- You prefer mastering spreadsheet modeling, financial ratios, and executive presentations over writing computer programming code.
Choose Data Analyst if:
- You are intrigued by human behavior, product experimentation, marketing conversion funnels, and uncovering operational efficiencies.
- You enjoy coding, solving technical puzzle problems, building automated systems, and cleaning complex datasets.
- You desire maximum industry mobility, with the freedom to work across gaming, tech, sports analytics, healthcare, e-commerce, or entertainment.
- You value flexible, remote-friendly work cultures and project-driven workflows over corporate financial calendar cycles.
Frequently Asked Questions (FAQ)
1. Which role is harder to learn: Financial Analyst or Data Analyst?
It depends on your natural affinity. Data analysis presents a steeper initial technical learning curve because you must learn programming syntax (SQL and Python) and database management concepts. Financial analysis requires a deeper conceptual understanding of accounting rules, regulatory frameworks, valuation math, and economic theory. Most beginners find SQL easier to learn than intermediate corporate finance.
2. Can a Financial Analyst be replaced by AI?
Routine bookkeeping and basic financial reporting are increasingly being automated by AI and enterprise software. However, strategic financial analysts who advise executives on mergers, acquisitions, risk management, and capital allocation cannot be replaced by AI. These roles require nuanced human judgment, ethical negotiation, and executive trust.
3. Can a Data Analyst be replaced by AI?
Basic SQL query writing and boilerplate dashboard generation are becoming accelerated by Large Language Models (LLMs). However, AI cannot independently determine which business questions matter, validate data cleanliness against operational reality, or persuade business stakeholders to change their strategic behavior. AI serves as a productivity amplifier for skilled data analysts rather than a replacement.
4. Do Financial Analysts need to know Python or SQL in 2026?
While not universally required, learning SQL and Python gives financial analysts an immense competitive advantage. Analysts who can extract data directly from enterprise data warehouses rather than waiting for IT teams to export CSVs produce faster, deeper analyses and stand out prominently in hiring pools.
5. Which career pays more over a full lifetime?
Both careers offer 6-figure earning potential within 3 to 5 years. For standard corporate roles, mid-level data analysts often earn slightly more than mid-level corporate financial analysts. However, in elite finance tracks (investment banking, hedge funds, private equity), financial compensation can exceed technology salaries through massive annual performance bonuses.
6. Can I become a Data Analyst with a Finance degree?
Absolutely. Finance is considered one of the top non-technical degrees for data analysts. Tech employers love hiring candidates who already understand revenue, profit margins, cost structures, and ROI, because teaching a finance graduate SQL is substantially faster than teaching a pure programmer commercial business acumen.
Published by the SkillRoadmaps Editorial Team | Updated for 2026 Industry Standards