
Mastering excel for data analysis remains one of the fastest, highest-ROI skills any aspiring data professional can acquire in 2026. Despite the rapid rise of Python, SQL, and enterprise cloud data warehouses, Microsoft Excel remains the most universally utilized analytics tool on the planet. From seed-stage startups to Fortune 500 boardrooms, more high-stakes financial, operational, and strategic decisions are finalized in spreadsheets than in any other software environment. For verified technical documentation and standards, refer to Official Microsoft Excel Functions Documentation.
However, for aspiring data analysts and career changers, learning Excel can feel overwhelming. With over 500 built-in functions, legacy ribbon menus, and decades of accumulated features, beginners frequently waste weeks memorizing obscure statistical formulas they will never touch in a real corporate role.
The truth is that 90% of professional data analysis in Excel relies on a lean, powerful core of modern formulas and built-in automation features. If you master these 7 essential Excel formulas and capabilities, you will execute data cleaning, cohort analysis, and executive reporting faster and with fewer errors than colleagues who rely on legacy workarounds.
Excel for Data Analysis: The 7 Essential Tools Every Analyst Must Master
| # | Formula / Feature | Primary Business Purpose | Why It Replaced Legacy Workarounds |
|---|---|---|---|
| 1 | XLOOKUP | Exact and approximate vertical/horizontal dataset merging. | Eliminates VLOOKUP column index errors; searches left and right natively. |
| 2 | INDEX / MATCH | Two-way matrix lookups and dynamic multi-criteria lookups. | Robust against column insertion; operates seamlessly across massive tables. |
| 3 | Power Query (Get & Transform) | Automated data extraction, cleaning, unpivoting, and ingestion. | Replaces repetitive manual copy-pasting; updates with a single click. |
| 4 | Pivot Tables & Pivot Charts | Instant multidimensional aggregation and exploratory analysis. | Summarizes millions of records in seconds without writing manual sum formulas. |
| 5 | Dynamic Array Functions (FILTER, UNIQUE, SORT) | Automated real-time list generation and data extraction. | Spills results automatically across rows without Ctrl+Shift+Enter legacy array traps. |
| 6 | SUMIFS & COUNTIFS | Conditional multi-criteria financial and operational aggregations. | Calculates segmented KPIs (e.g., Q3 revenue for North America enterprise tier). |
| 7 | Data Validation & Conditional Formatting | Input error prevention and visual executive anomaly detection. | Guarantees clean user inputs and highlights outlier metrics dynamically. |
Curious how developing these analytical skills impacts your earning potential? Use our free Tech Salary & Bootcamp ROI Calculator to model compensation curves and ROI across data and finance career paths.
Excel for Data Analysis 1: XLOOKUP for Modern Data Merging
For over two decades, VLOOKUP was the universal badge of spreadsheet competence. However, VLOOKUP suffered from severe architectural flaws: it could not look to the left of the lookup key, it broke whenever someone inserted a new column into the source table, and it defaulted to approximate matches if you forgot to add FALSE at the end.
Introduced in modern versions of Excel, XLOOKUP solves every single limitation of VLOOKUP while offering superior execution speed.
The Syntax
=XLOOKUP(lookup_value, lookup_array, return_array, [if_not_found], [match_mode], [search_mode])
Real-World Business Example: Customer Churn in excel for data analysis
Applying modern lookup functions in excel for data analysis allows analysts to reconcile customer billing rosters in seconds.
Imagine you have a monthly churn report on Sheet 1 containing customer_id in Column A. You need to pull the customer’s account_manager from an internal master registry on Sheet 2, where the customer_id is located in Column C and the account_manager is in Column B (to the left!).
With VLOOKUP, this was impossible without altering the source spreadsheet. With XLOOKUP, it is effortless:
=XLOOKUP(A2, Sheet2!$C$2:$C$10000, Sheet2!$B$2:$B$10000, "Unassigned", 0)
If the customer ID does not exist in the database, XLOOKUP automatically outputs “Unassigned” instead of throwing an ugly #N/A error across your dashboard.
Excel for Data Analysis 2: INDEX / MATCH Matrix Lookups
While XLOOKUP handles 95% of standard lookups, mastering the classic combination of INDEX and MATCH remains a mandatory requirement for senior data analysts and financial modelers. Why? Because INDEX/MATCH excels at two-dimensional coordinate lookups (matching both a row header and a column header simultaneously).
The Syntax
=INDEX(array, MATCH(lookup_row_val, lookup_row_range, 0), MATCH(lookup_col_val, lookup_col_range, 0))
Real-World Business Example: Tiered Pricing Matrix
Suppose you have a wholesale pricing grid where rows represent Product SKUs and columns represent Order Volume Tiers (1–49 units, 50–99 units, 100+ units). To dynamically extract the correct unit price for an order, INDEX/MATCH matches the SKU vertically and the Volume Tier horizontally, returning the exact matrix intersection point instantly.
3. Power Query: The Built-in ETL Game Changer

If you are still opening a CSV file, manually deleting columns, copy-pasting data below yesterday’s rows, splitting text with delimiter wizards, and using Find-and-Replace to clean date formats, you are wasting dozens of hours every month.
Power Query (Get & Transform) is the single most powerful feature added to Excel in the last 15 years. It is a full-fledged ETL (Extract, Transform, Load) engine built directly into Excel.
What Power Query Automates in Seconds:
- Automated Folder Consolidation: Point Power Query at a shared folder. Whenever team members drop 12 new monthly regional sales CSVs into that folder, clicking “Refresh All” automatically ingests, unifies, and formats every file into a single clean master table.
- Unpivoting Wide Data: Frequently, accounting teams share budgets formatted horizontally (Jan, Feb, Mar across columns). Power Query transforms wide data into narrow, database-ready normalized rows with two clicks.
- Merging Disparate Data Sources: Join customer transaction records from a SQL database with customer survey responses stored in a Google Sheet or Excel workbook.
Once you record your transformation steps in Power Query, they are preserved permanently in M-Code. Tomorrow morning’s update takes exactly one click.
4. Pivot Tables & Pivot Charts: Instant Multidimensional Insight
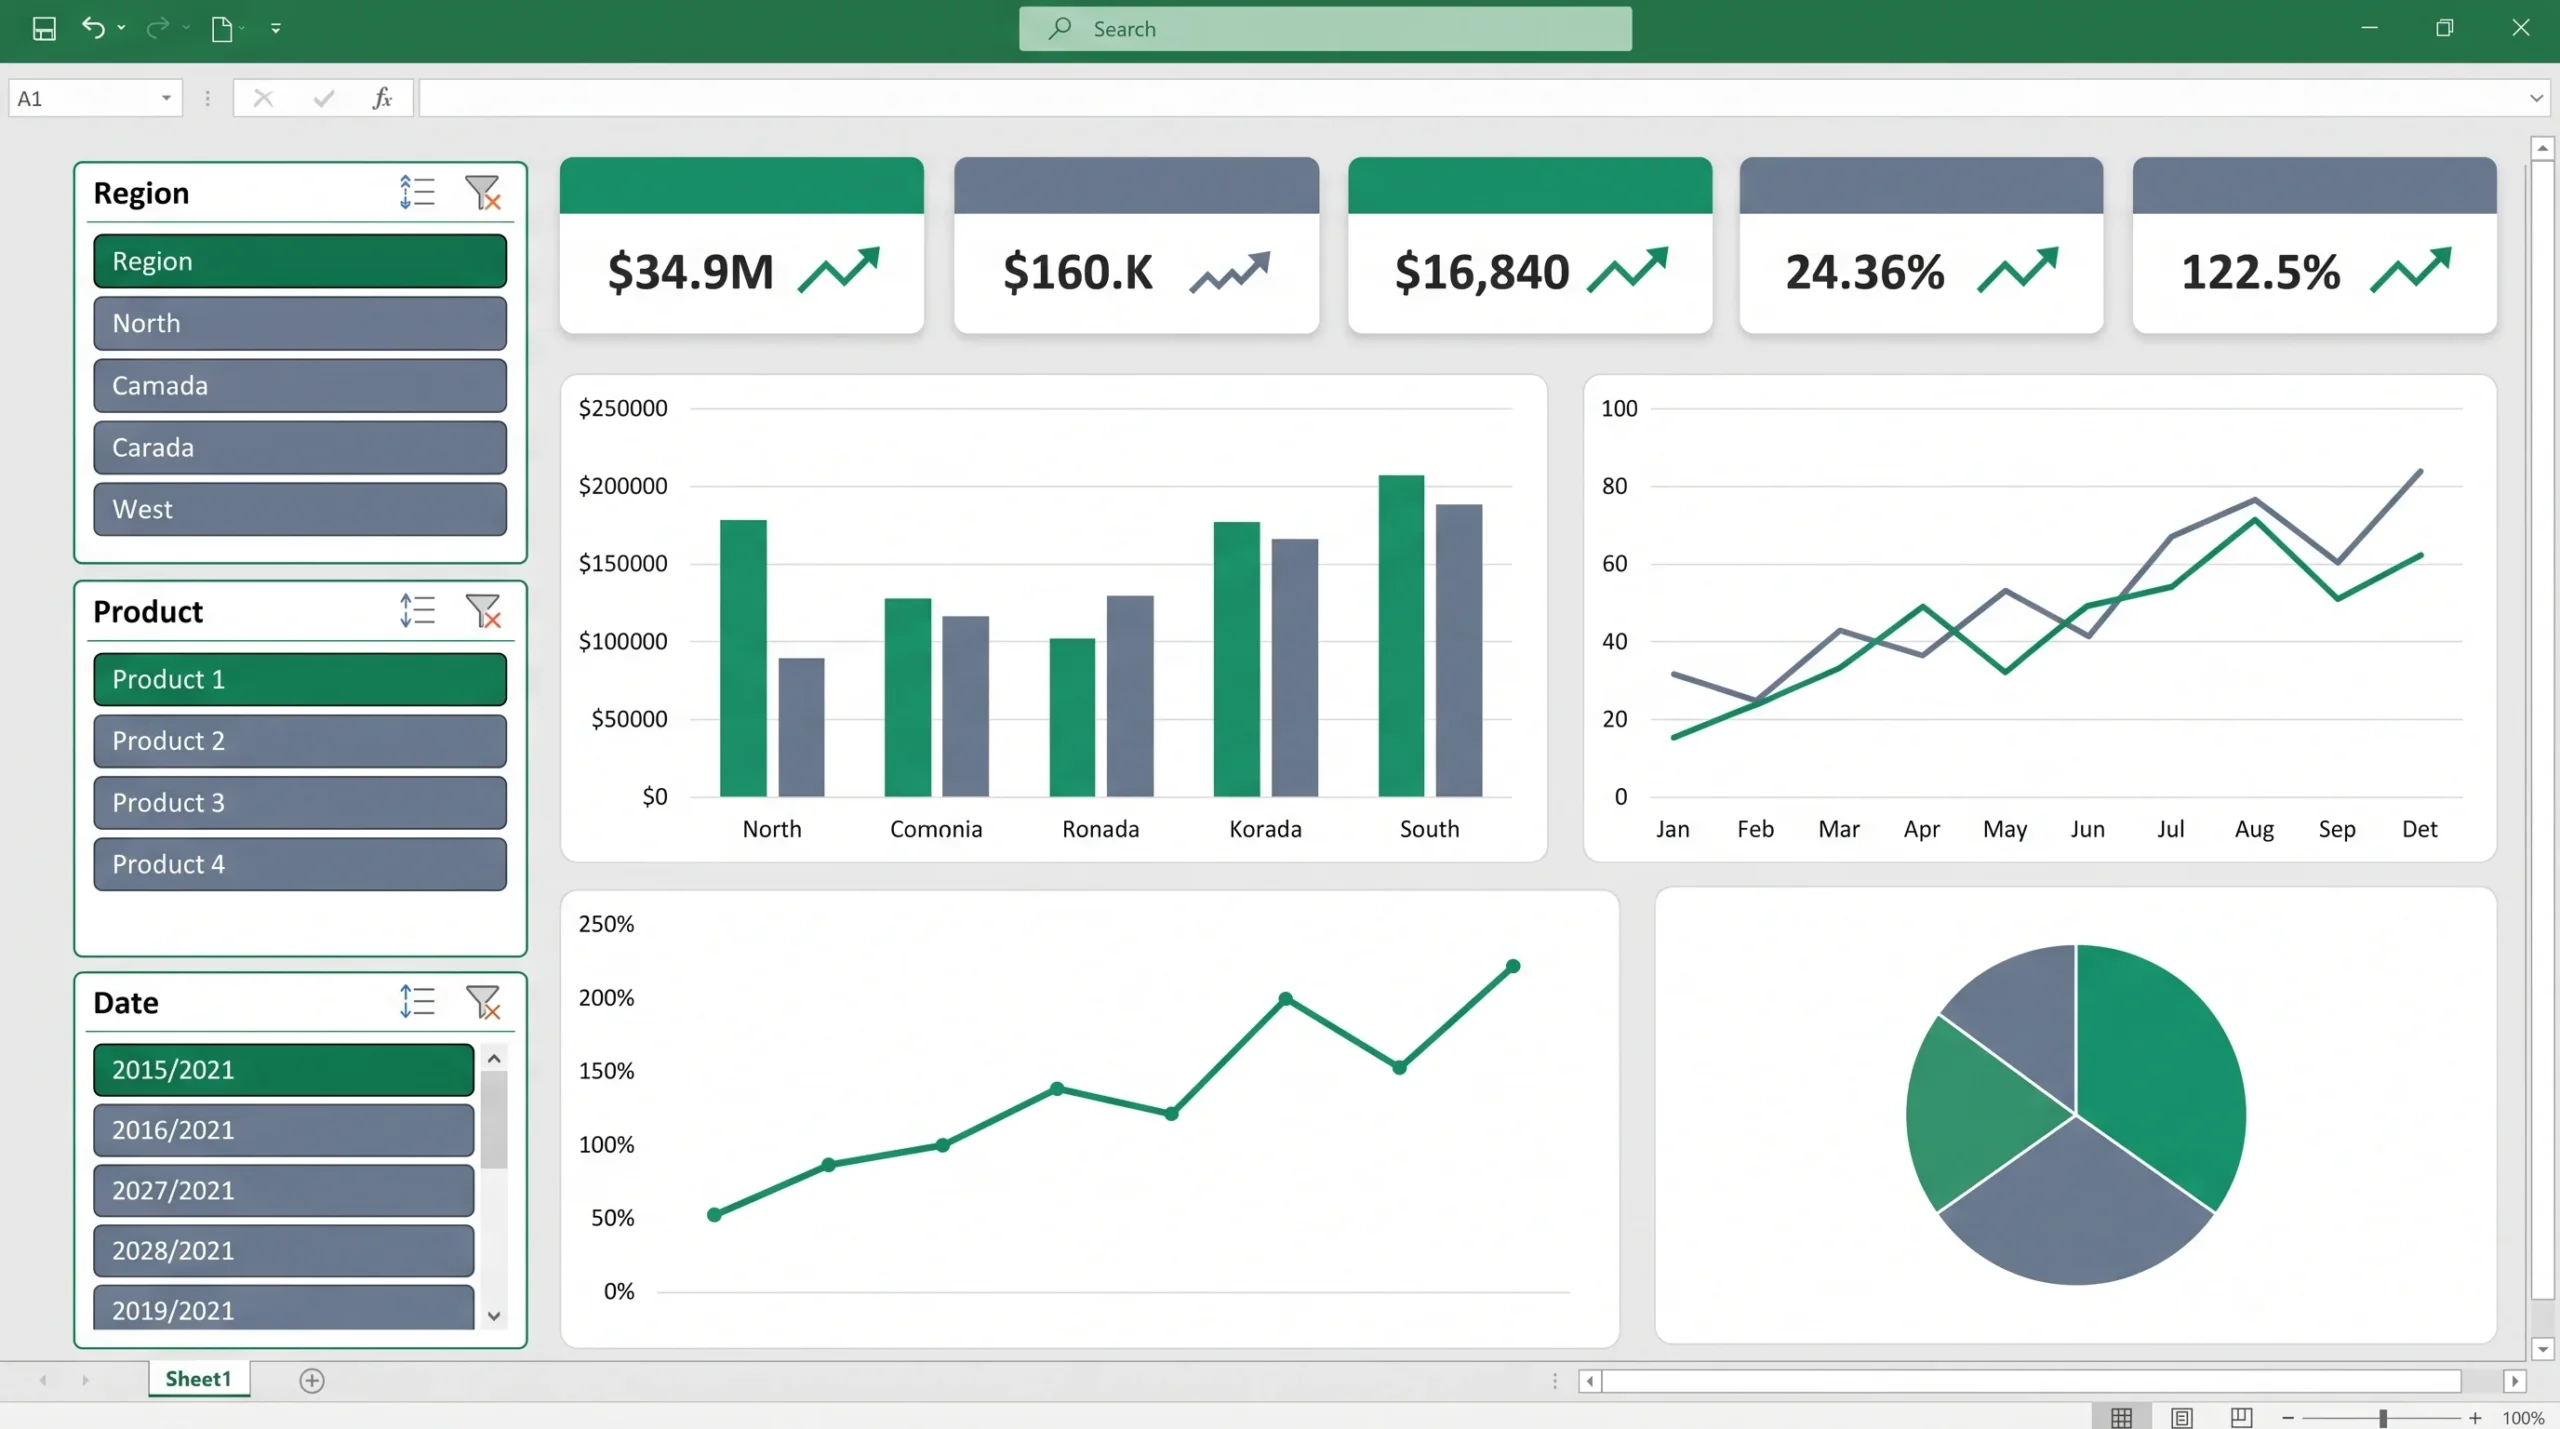
A dataset with 250,000 transaction rows is completely useless to an executive until it is summarized. Pivot Tables allow analysts to slice, dice, group, and aggregate massive raw data tables in seconds without writing a single line of code.
Advanced Pivot Table Best Practices for 2026:
- Tabular Layout by Default: Never use the cluttered “Compact Form”. Go to Design → Report Layout → Show in Tabular Form and select Repeat All Item Labels to make Pivot Table exports database-friendly.
- Custom Value Calculations: Rather than settling for basic sums, right-click any metric value and use Show Values As → % of Column Total, Running Total In, or Difference From Previous Period to analyze growth trajectories.
- Timeline & Slicer Synchronization: Connect interactive visual slicers across multiple Pivot Tables to build dynamic, interactive dashboard controls that filter revenue by region, product tier, and date range concurrently.
5. Dynamic Array Formulas: FILTER, UNIQUE, and SORT
Introduced in the modern calculation engine of Excel, dynamic array formulas allow a single formula entered into one cell to “spill” an entire array of results across adjacent rows and columns automatically.
A. The UNIQUE Function
Instantly extracts distinct values from a messy column containing duplicates:
=SORT(UNIQUE(Orders[customer_region]))
This single formula generates an alphabetized list of all active operating regions that automatically updates whenever a new region is added to the orders table.
B. The FILTER Function
Extracts matching records from an entire dataset based on dynamic boolean logic:
=FILTER(Orders, (Orders[Status]="Delivered") * (Orders[Order_Value]>500), "No High-Value Orders")
This creates a live, filtered secondary table containing only delivered orders valued over $500 without requiring VBA scripts or manual filtering.
6. SUMIFS & COUNTIFS: Surgical Multi-Condition Aggregations
When building executive summary KPI scorecards or financial models, analysts frequently need to compute metrics with specific operational constraints.
The Syntax
=SUMIFS(sum_range, criteria_range1, criterion1, [criteria_range2, criterion2], ...)
Real-World Business Example: Marketing Attribution
Suppose you need to calculate the total revenue generated from enterprise clients who registered via organic search during Q3:
=SUMIFS(Revenue[Amount], Revenue[Channel], "Organic Search", Revenue[Tier], "Enterprise", Revenue[Close_Date], ">=2026-07-01", Revenue[Close_Date], "<=2026-09-30")
By locking cell references ($A$1), you can drag this formula across a summary grid to populate an entire quarterly executive report in seconds.
7. Data Validation & Conditional Formatting
Data integrity is the bedrock of credible analysis. If stakeholders enter inconsistent data (“CA”, “Calif”, “California”), automated formulas and Pivot Tables will fragment into inaccurate silos.
Data Validation: Restricting Inputs at the Source
Use Data → Data Validation → List to constrain user input cells strictly to approved dropdown values. This guarantees that operational staff cannot submit typos, invalid currency symbols, or out-of-range dates.
Conditional Formatting: Visual Anomaly Detection
Rather than using flashy, rainbow-colored highlights that distract executives, apply disciplined, subtle conditional formatting rules:
- Highlight the bottom 5% of product profit margins in soft light red to flag margin deterioration.
- Apply subtle data bars inside table cells to give readers immediate visual context of volume distribution without requiring separate charts.
- Use custom formula rules (e.g.,
=$D2>TODAY()+30) to highlight upcoming contract expiration dates automatically.
When Should You Graduate from Excel to SQL and Python?
Excel is an extraordinary tool, but knowing its practical limitations is the hallmark of a mature data analyst:
- Row Capacity Limits: Excel cannot exceed 1,048,576 rows. In reality, workbooks containing more than 300,000 rows with complex formulas begin to lag, consume gigabytes of RAM, and crash unexpectedly.
- Auditability & Version Control: Spreadsheet cells can be accidentally overwritten by team members without leaving an audit trail. In contrast, SQL scripts and Python code can be version-controlled in GitHub.
- Repetitive Ingestion Pipelines: When datasets must be refreshed hourly from transactional cloud databases, transitioning your logic to SQL views and cloud data warehouses is mandatory.
To master the transition into relational database querying, follow our structured guide: How to Learn SQL in 30 Days. And if you are deciding which programming language to pair with Excel, review our Python for Data Analysis Roadmap.
Frequently Asked Questions (FAQ)
1. Is Excel still necessary for data analysts in 2026?
Yes, absolutely. While data engineers and backend scientists work primarily in Python and SQL, business stakeholders, finance leaders, and executives live in Excel. Analysts who can quickly prototype solutions, audit raw data, and present executive summaries in spreadsheets remain invaluable.
2. Which is better: XLOOKUP or INDEX/MATCH?
XLOOKUP is faster, simpler to write, and handles error catching natively for 95% of vertical and horizontal lookups. However, INDEX/MATCH remains essential for two-dimensional matrix lookups (matching both rows and columns simultaneously) and for compatibility with older legacy versions of Excel.
3. Can Excel handle Big Data?
Standard Excel worksheets have a strict hard limit of 1,048,576 rows. However, using Excel’s built-in Power Pivot Data Model (xVelocity engine), you can ingest and compress tens of millions of rows into an internal analytical model that executes fast DAX calculations.
4. How long does it take to learn Excel for data analysis?
Focusing strictly on the 7 essential tools covered in this guide (XLOOKUP, INDEX/MATCH, Power Query, Pivot Tables, dynamic arrays, SUMIFS, and validation), an analytical beginner can become job-ready within 3 to 4 weeks of dedicated daily practice.
5. Do data analyst jobs require Excel VBA and Macros?
VBA (Visual Basic for Applications) is rapidly declining in modern analytics. Most enterprise automation that previously required complex VBA code is now handled substantially more reliably by Power Query, Power Automate, or simple Python scripts.
6. What are the best free datasets to practice Excel data analysis?
Kaggle, Google Dataset Search, and the US Census Bureau offer thousands of free, messy datasets. Practice cleaning e-commerce transaction logs, hospital patient admission records, and financial earnings tables. Generate project ideas tailored to your background with our free Portfolio Project Generator.
Published by the SkillRoadmaps Editorial Team | Updated for 2026 Industry Standards