
Preparing for technical data analyst interview questions is the final and most critical hurdle between building analytical skills and landing a high-paying data offer in 2026. Landing a job as a data analyst requires navigating one of the most multifaceted interview processes in tech. While traditional corporate roles often depend on conversational chemistry and resume credentials, data analytics interviews rigorously test your practical problem-solving capabilities across three distinct dimensions: technical query proficiency (SQL & Python), commercial problem-solving & product intuition, and behavioral storytelling under pressure. For verified technical documentation and standards, refer to LeetCode Database SQL Practice Platform.
Hiring panels do not just want to know whether you can write syntactically correct code. They want to see how you dissect ambiguous business problems, how you validate data cleanliness before trusting output, and how you communicate technical findings to non-technical stakeholders.
To give you an unfair advantage in your interview cycle, we analyzed hundreds of real interview debriefs from Google, Amazon, Spotify, financial institutions, and fast-growing tech startups. Here are the top 25 data analyst interview questions, organized by category, with complete code solutions, architectural explanations, and battle-tested answering frameworks.
Data Analyst Interview Questions: Core SQL Technical Challenges (With Code)
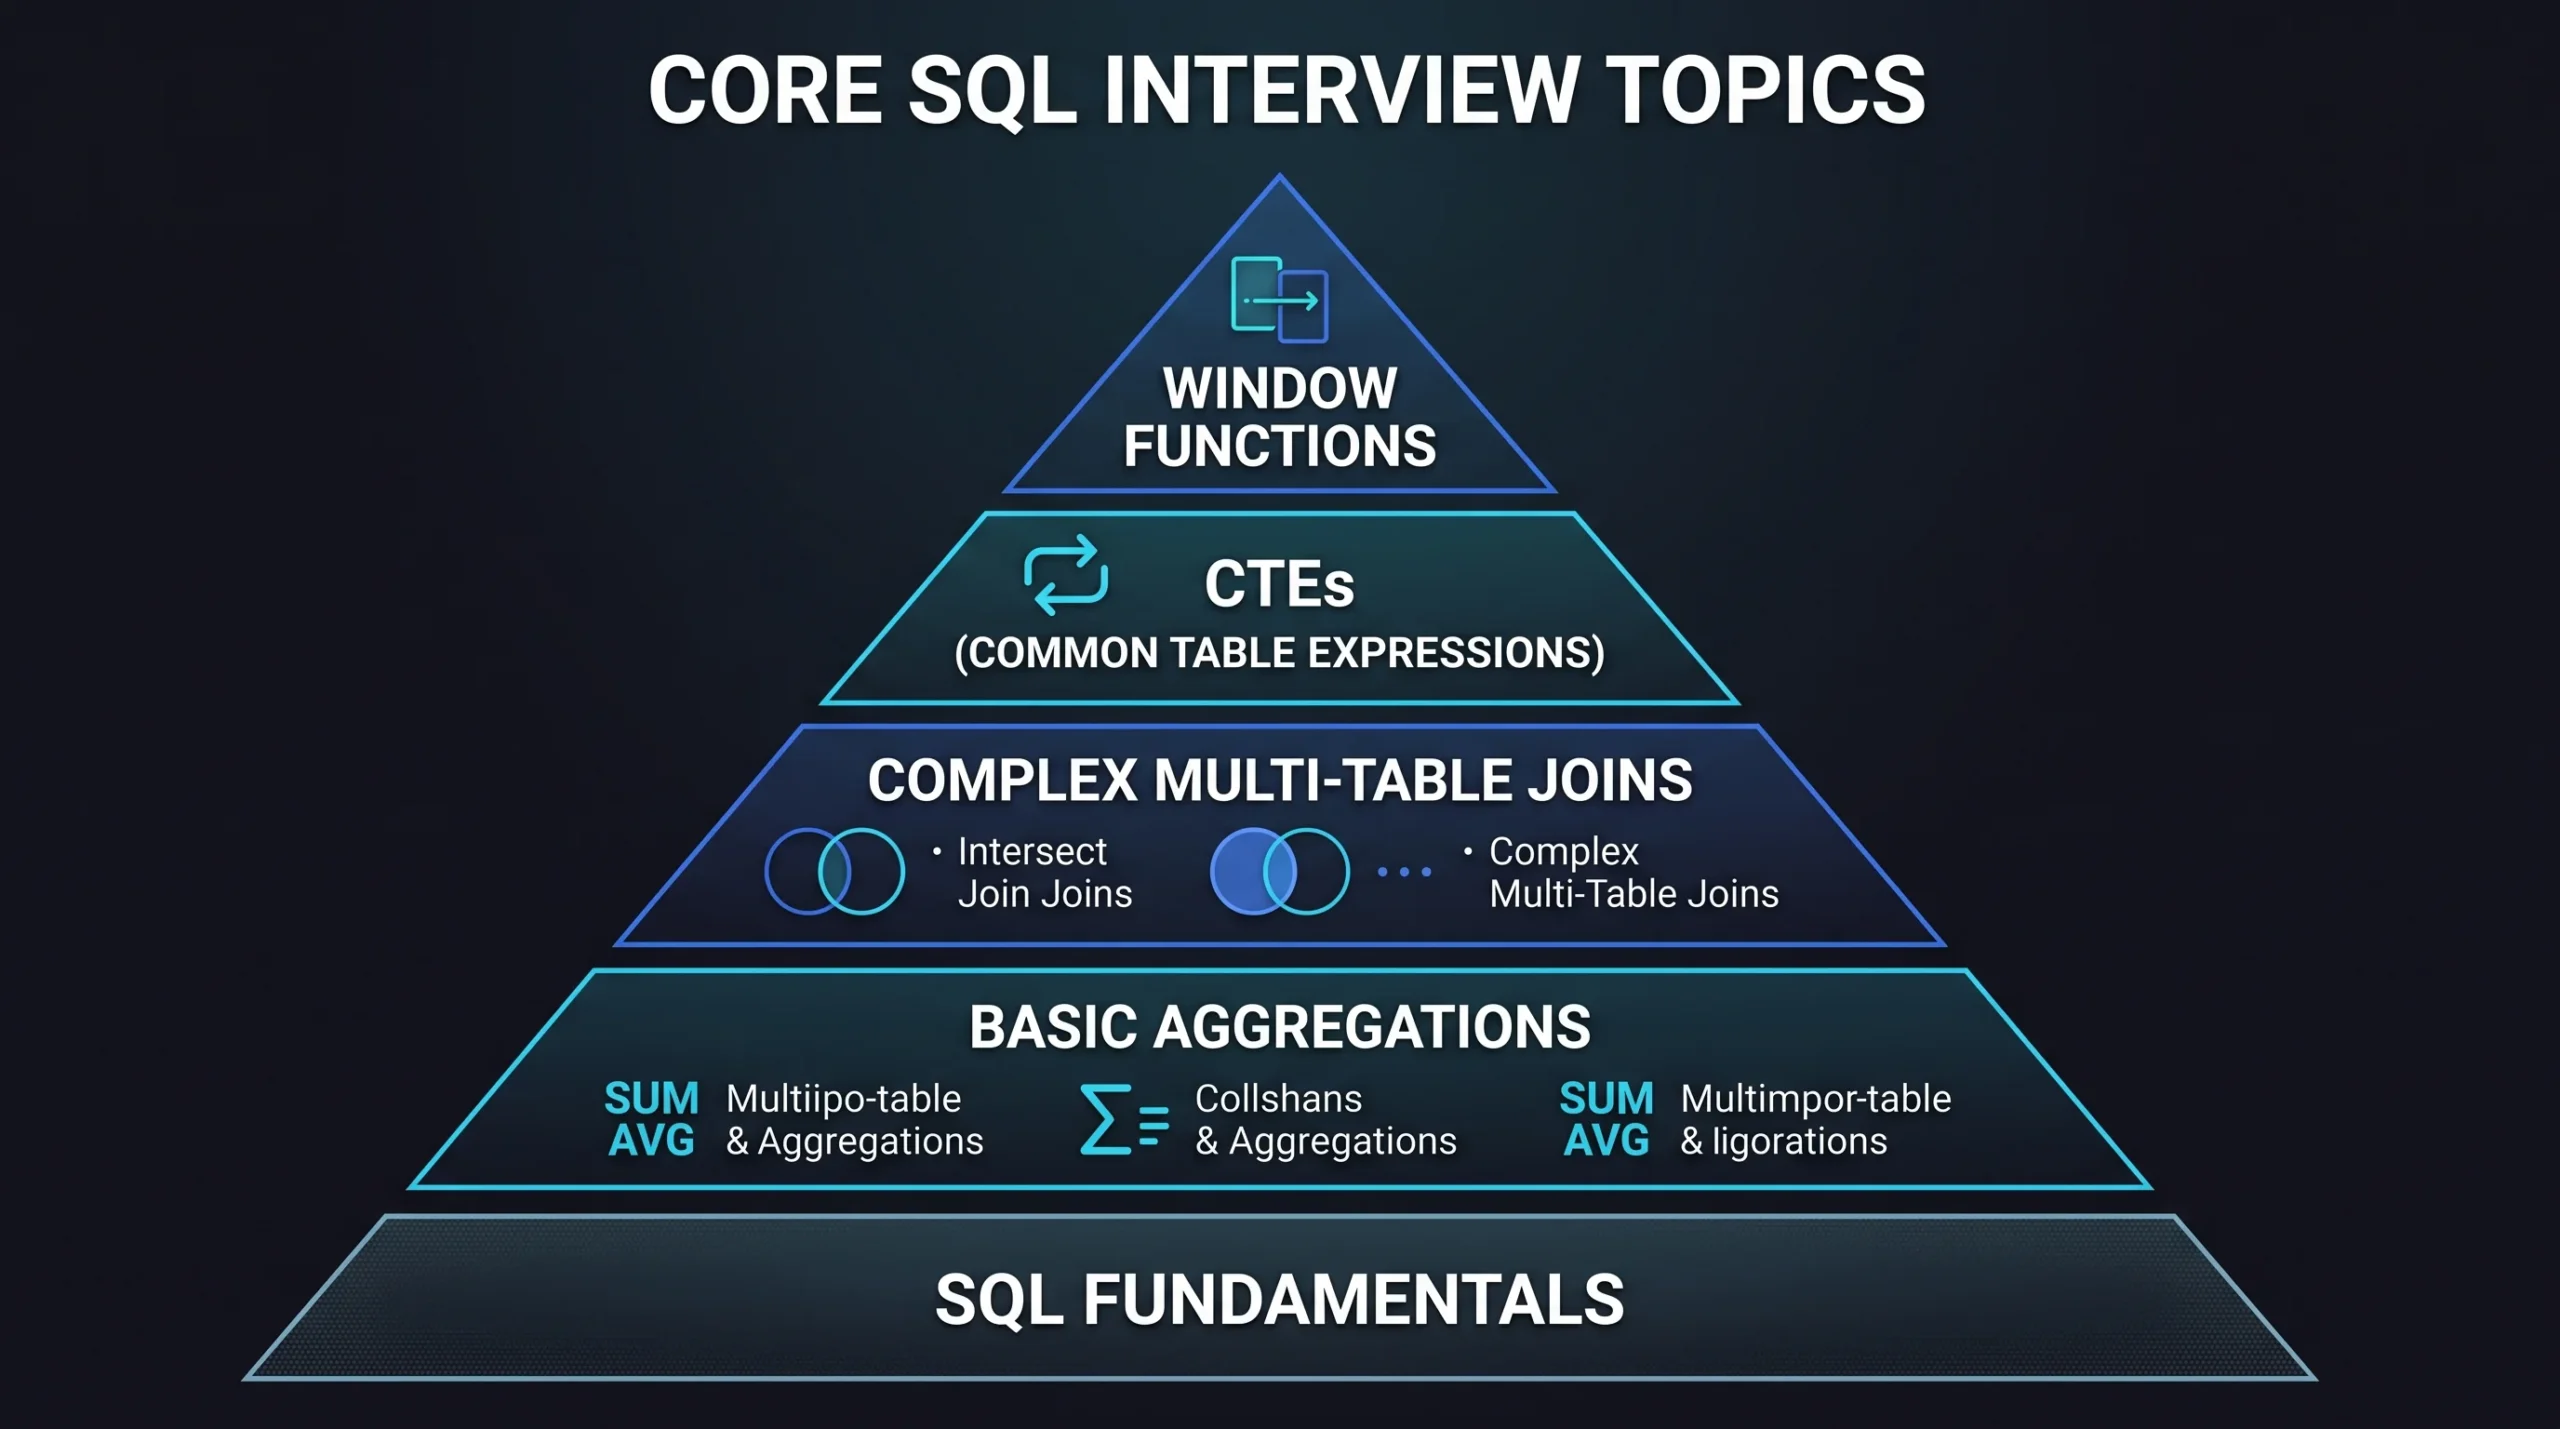
SQL tests are the primary technical screening filter. If you stumble here, most tech companies will not advance you to behavioral rounds.
1. In data analyst interview questions, what is the difference between WHERE and HAVING?
The Conceptual Answer: The WHERE clause filters individual records before any grouping or aggregation takes place. The HAVING clause filters groups of records after an aggregation (such as SUM(), COUNT(), or AVG()) has been calculated by a GROUP BY clause.
-- Example: Find departments where the total salary expense exceeds $500,000,
-- but only evaluate full-time active employees
SELECT department_id, SUM(salary) AS total_payroll
FROM employees
WHERE employee_status = 'Active' -- Evaluated BEFORE grouping
GROUP BY department_id
HAVING SUM(salary) > 500000;      -- Evaluated AFTER grouping
2. Common data analyst interview questions: How do ROW_NUMBER(), RANK(), and DENSE_RANK() differ?
The Conceptual Answer: All three are window functions that assign sequential rankings to rows within a partition, but they handle tied values differently:
ROW_NUMBER(): Assigns a unique sequential integer to every row regardless of ties (e.g., 1, 2, 3, 4).RANK(): Assigns identical ranks to tied values, but skips subsequent rank numbers to account for the tie (e.g., 1, 2, 2, 4).DENSE_RANK(): Assigns identical ranks to tied values without skipping subsequent numbers (e.g., 1, 2, 2, 3).
-- Real Interview Challenge: Find the second highest salary in each department
WITH RankedSalaries AS (
    SELECT
        employee_id,
        department_id,
        salary,
        DENSE_RANK() OVER (PARTITION BY department_id ORDER BY salary DESC) as salary_rank
    FROM employees
)
SELECT department_id, salary
FROM RankedSalaries
WHERE salary_rank = 2;
3. Essential data analyst interview questions: Explain UNION vs UNION ALL
The Conceptual Answer: Both operators combine the result sets of two or more SELECT statements into a single table. However, UNION performs an internal sorting and deduplication step to return only distinct rows, which is computationally expensive on large datasets. UNION ALL simply concatenates all rows together including duplicates, making it substantially faster. In production data pipelines, always default to UNION ALL unless deduplication is explicitly required by the business logic.
4. Practical data analyst interview questions: Finding inactive customers with LEFT JOIN
Interviewers ask this question to evaluate whether you understand set differences and anti-joins. Candidates can solve this using either a LEFT JOIN with a null check or a NOT EXISTS subquery:
-- Method A: LEFT JOIN (Anti-Join Pattern)
SELECT c.customer_id, c.customer_name
FROM customers c
LEFT JOIN orders o ON c.customer_id = o.customer_id
WHERE o.order_id IS NULL;

-- Method B: NOT EXISTS (Often more performant on large indexed tables)
SELECT c.customer_id, c.customer_name
FROM customers c
WHERE NOT EXISTS (
    SELECT 1 FROM orders o WHERE o.customer_id = c.customer_id
);
5. Standard data analyst interview questions: Explaining CTE advantages over subqueries
The Conceptual Answer: A CTE (defined using the WITH keyword) creates a temporary named result set accessible within the execution scope of a single query. CTEs dramatically enhance query readability, modularity, and maintainability compared to deeply nested subqueries. Furthermore, recursive CTEs allow analysts to traverse hierarchical data structures, such as organizational charts or multi-touch customer clickstreams.
To practice these and dozens of additional live query patterns, work through our structured day-by-day plan: How to Learn SQL in 30 Days.
Part 2: Data Cleaning, Python & Statistics Questions
Modern data analysts must demonstrate rigor in cleaning dirty data and applying fundamental statistical concepts.
6. How do you handle missing values in a dataset?
The Ideal Answer: Avoid jumping straight to “I replace them with the mean.” Senior interviewers look for a systematic, diagnostic approach:
- Identify the Mechanism: Determine whether the data is Missing Completely at Random (MCAR), Missing at Random (MAR), or Missing Not at Random (MNAR). Missing income data on a survey is rarely random.
- Evaluate Volume: If missing records account for less than 1% of a massive dataset, dropping them may be safe. If they represent 20%+, dropping causes severe selection bias.
- Select Imputation Strategy: For numerical data with outliers, use median imputation rather than mean. For categorical data, use the mode or create a dedicated “Unknown” category. For time-series data, use forward-fill or backward-fill interpolation.
- Domain Validation: Verify with domain experts whether a null value carries specific business meaning (e.g., a null “cancellation_date” simply indicates an active subscriber).
7. What is the difference between Correlation and Causation? Give a business example.
The Ideal Answer: Correlation measures the statistical association or co-movement between two variables, while causation proves that a change in one variable directly produces a change in the other.
Example: An e-commerce app might observe that users who visit the “Help & FAQ” page churn at a 40% higher rate than users who don’t. A naive analyst might suggest removing the FAQ link to reduce churn (confusing correlation with causation). In reality, users visit the FAQ page because they are already encountering billing bugs or delivery delays; the frustration causes both the FAQ visits and the subsequent churn.
8. What is an A/B test, and how do you determine sample size?
The Ideal Answer: An A/B test is a controlled randomized experiment where two variants (A and B) are presented to split cohorts of users to determine which performs better against a key metric (e.g., conversion rate). Sample size is calculated before launching the test based on four parameters:
- Baseline Conversion Rate: Current performance of the control group.
- Minimum Detectable Effect (MDE): The smallest percentage uplift that is commercially meaningful to detect.
- Statistical Power ($1 – \beta$, usually 80%): Probability of detecting an effect if it truly exists.
- Significance Level ($\alpha$, usually 5%): Probability of falsely concluding a difference exists (Type I error).
9. How do you detect and handle outliers in a dataset?
The Ideal Answer: Outliers can be detected visually using boxplots and scatterplots, or quantitatively using statistical rules:
- Z-Score Method: Useful for normally distributed data; values with $|Z| > 3$ are typically flagged as outliers.
- Interquartile Range (IQR) Method: Robust against skewed distributions. Outliers are values outside $[Q1 – 1.5 \times IQR, Q3 + 1.5 \times IQR]$.
Never delete outliers automatically without investigating their origin. An extreme transaction could represent fraud, an enterprise B2B buyer, or a telemetry sensor malfunction. Treat true anomalies separately or apply Winsorization (capping at 95th/99th percentiles).
Part 3: Behavioral Questions & The STAR Method
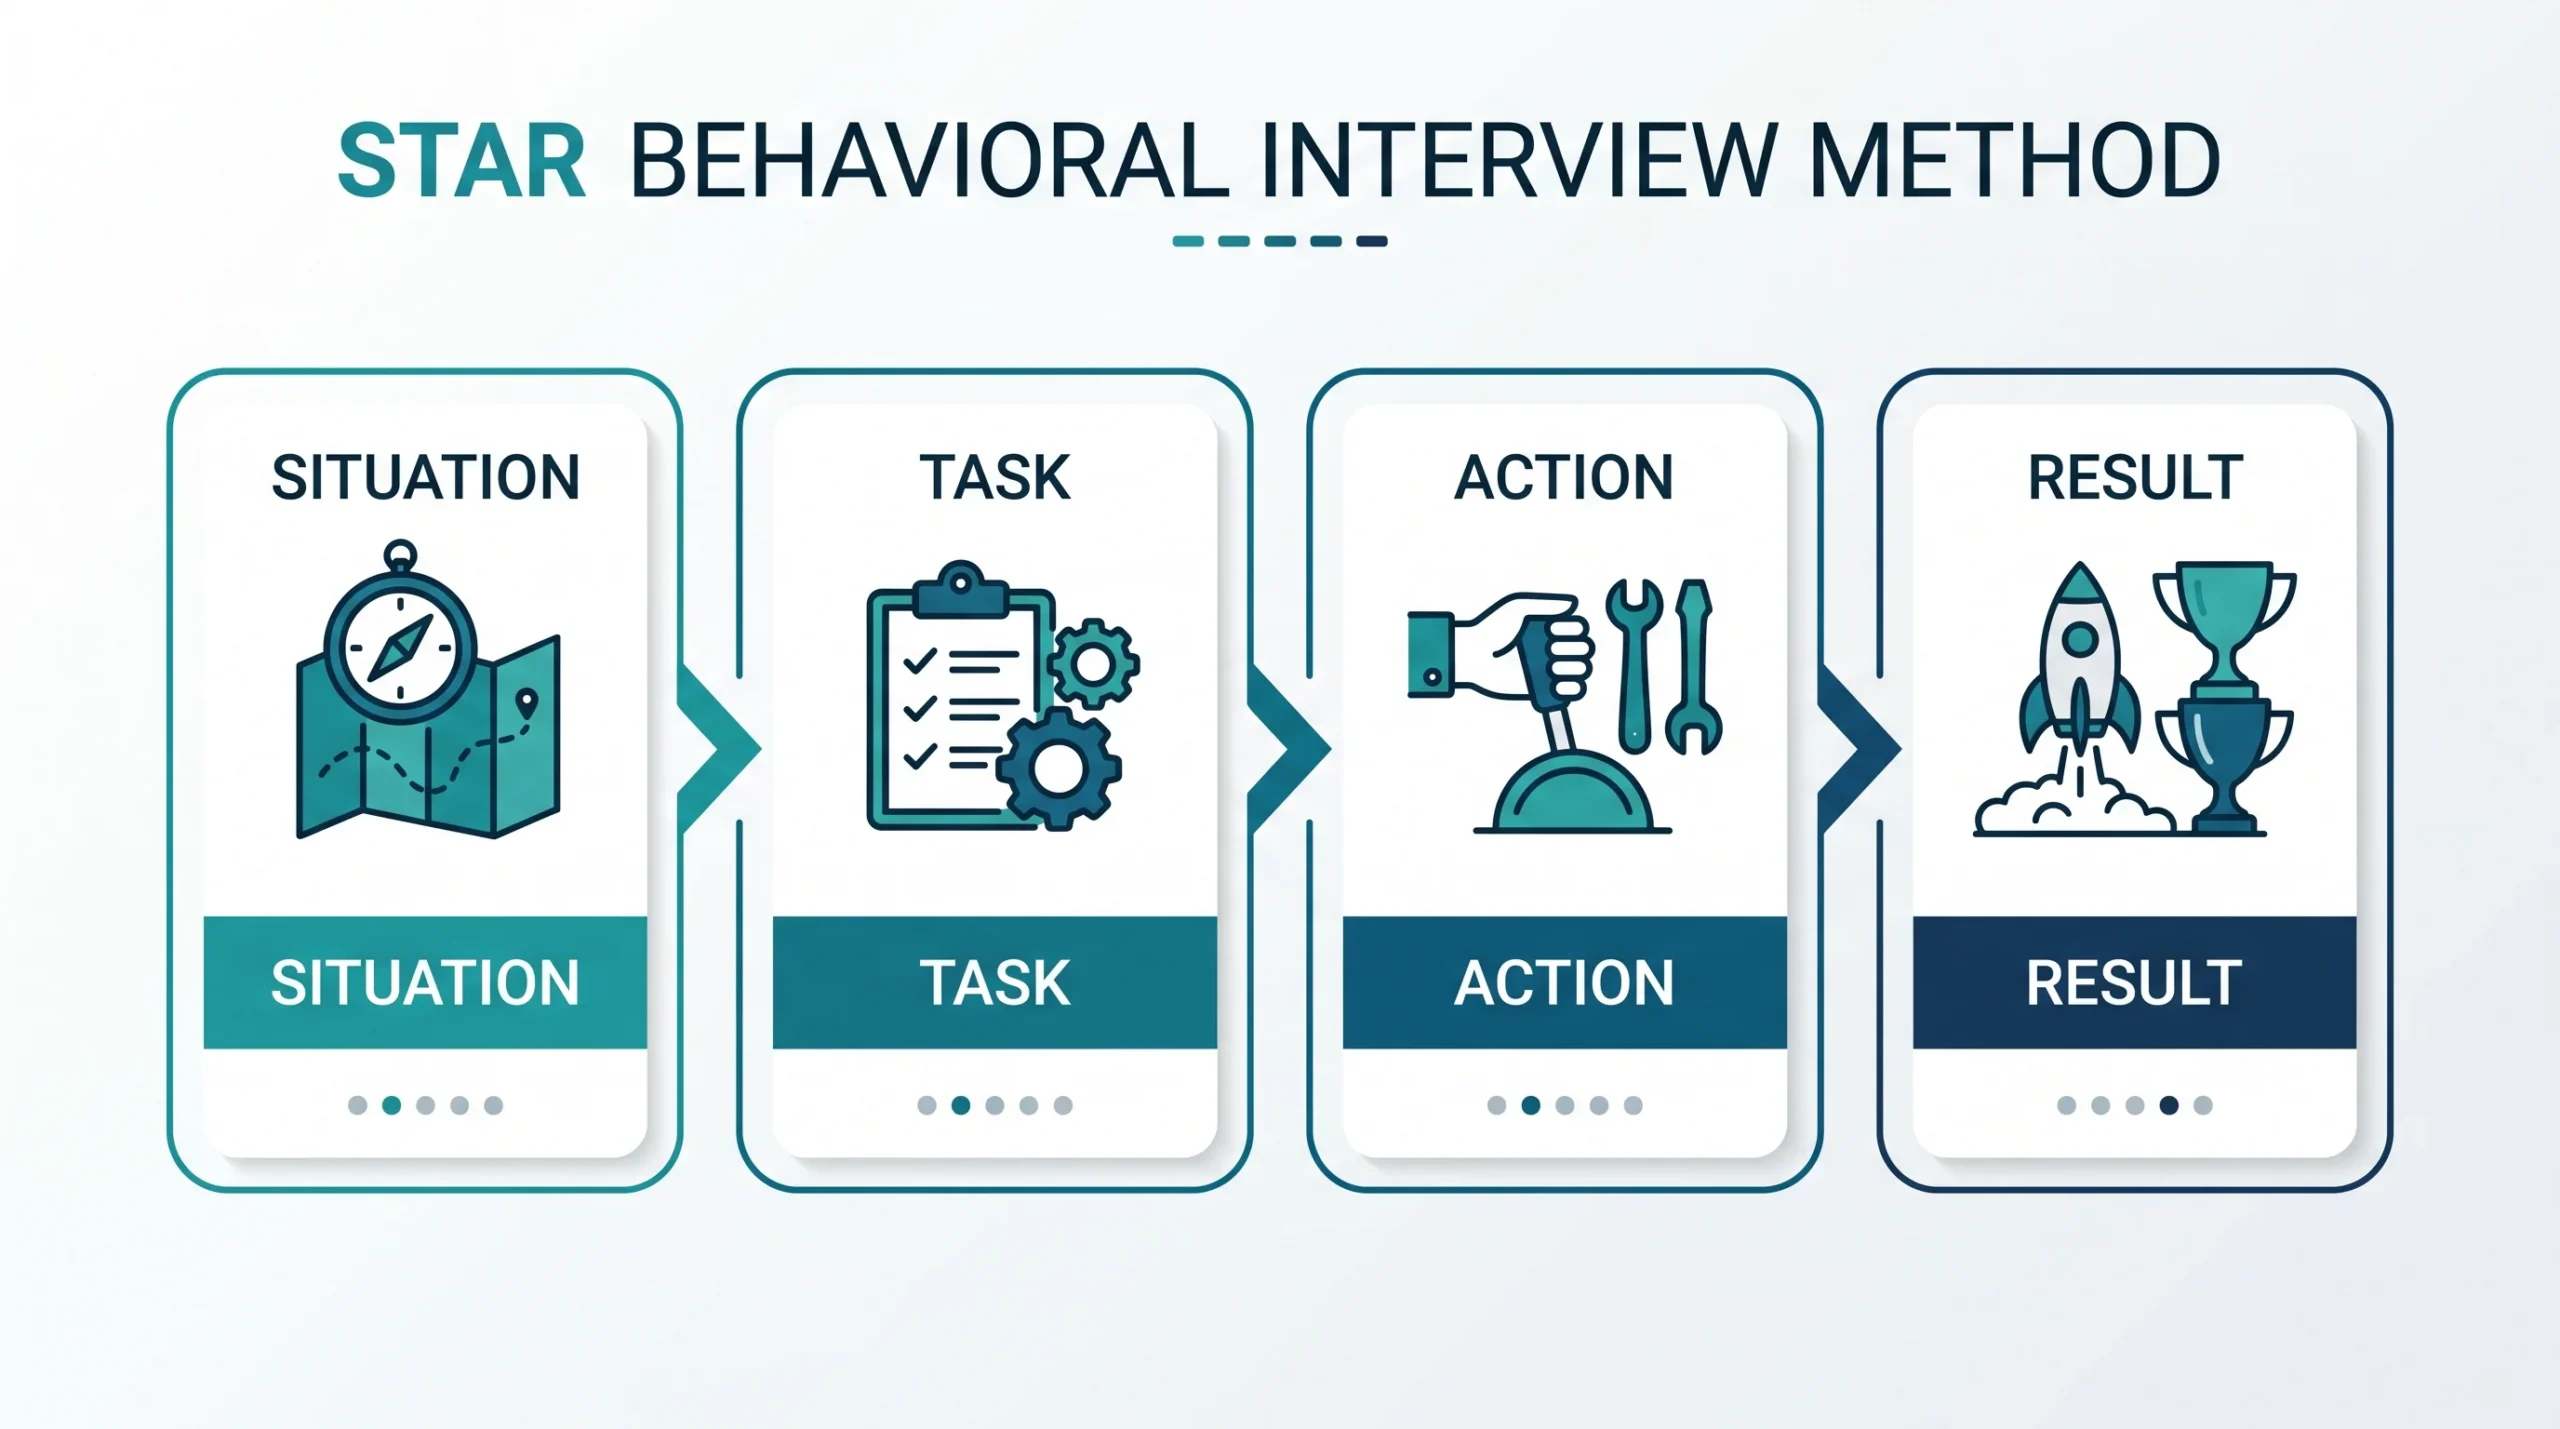
Technical skills get you the interview; behavioral competence gets you the job offer. Use the STAR Method (Situation, Task, Action, Result) to deliver concise, compelling answers with quantified business impact.
10. Tell me about a time you found an unexpected insight in the data that changed a business decision.
Example Framework:
- Situation: At my previous company, marketing leadership was preparing to allocate $200,000 to expand our social media advertising based on top-of-funnel registration volume.
- Task: My objective was to validate cohort retention and customer acquisition cost (CAC) across each marketing channel over a 90-day window.
- Action: I built a cohort analysis model in Python and SQL joining advertising spend with transactional subscription renewals. I discovered that while social media drove high initial signups, 72% churned before their second billing cycle, resulting in a negative ROI. In contrast, organic search referrals had a 4x higher 6-month lifetime value.
- Result: Leadership shifted 60% of the proposed budget toward organic content and SEO initiatives, which reduced our blended customer acquisition cost by 28% while improving net recurring revenue.
11. How do you handle pushback from an executive when your data contradicts their intuition?
The Ideal Strategy: Demonstrate empathy, transparency, and intellectual humility:
- Never tell an executive “you are wrong” publicly. Recognize that their intuition is often built on years of qualitative industry experience that may capture nuances the data warehouse missed.
- Walk them through the methodology transparently: outline data sources, sample sizes, edge-case filters, and potential limitations.
- Invite them to stress-test your assumptions: “Here is what the data currently demonstrates under these parameters. What assumptions or blind spots should we examine together to validate this further?”
Part 4: Business Sense & Product Analytics Questions
12. Our app’s Daily Active Users (DAU) dropped by 10% yesterday. How do you investigate?
Senior interviewers ask this classic diagnostic question to evaluate your analytical structure under pressure. Avoid guessing specific bugs immediately; outline a systematic investigative framework:
- Validate the Data Integrity First: Is the drop real, or did an ETL pipeline fail? Did a tracking event break in the latest mobile app deployment? Check telemetry logs before alerting the CEO.
- Isolate Time & Seasonality: Was yesterday a national holiday? Is there a normal day-of-week cyclical drop (e.g., B2B software dropping on Sundays)?
- Segment Geographically & Technically: Is the drop concentrated in a specific country (suggesting ISP outages or regional payment issues) or on a specific OS version (suggesting an iOS crash bug)?
- Examine Cohorts: Did new user signups drop (marketing/onboarding funnel issue), or did existing active users fail to log in (retention/server outage issue)?
13. How do you choose the “North Star Metric” for a product?
The Ideal Answer: A North Star Metric is the single key metric that best captures the core value your product delivers to customers while driving sustainable business revenue. It must satisfy three criteria: it reflects customer value, measures company progress, and is actionable by the team.
- Spotify: Time spent listening to music (not just app opens).
- Airbnb: Nights booked (not just website search volume).
- Slack: Messages sent within active teams.
Part 5: Questions YOU Should Ask the Interviewer
At the conclusion of every interview, you will be invited to ask questions. Asking insightful questions signals high business maturity and genuine enthusiasm for the role:
- “How mature is your modern data stack? Are your analysts primarily writing queries on clean dbt models, or do you spend significant time wrangling raw operational tables?”
- “What is the typical cadence of work between analytics and product management? Do analysts operate within embedded cross-functional squads, or as a centralized service bureau?”
- “What is the single highest-priority business question leadership is currently trying to answer using data over the next two quarters?”
Curious what salary offer you should negotiate once you pass your interviews? Check out our free Tech Salary & Bootcamp ROI Calculator to benchmark local market rates and compare total compensation packages.
Frequently Asked Questions (FAQ)
1. How long should I prepare for a data analyst interview?
Most candidates require 4 to 8 weeks of focused preparation. Dedicate 50% of your time to daily SQL and data wrangling practice on platforms like LeetCode and Stratascratch, 30% to structuring your behavioral STAR stories, and 20% to reviewing business metrics and dashboard design principles.
2. Do data analyst interviews require live coding?
Yes. The vast majority of mid-tier and tech companies conduct live coding screens via shared editors (such as CoderPad or HackerRank) where you must write SQL queries and explain your logic out loud to an interviewer.
3. What should I do if I get stuck on a coding question during an interview?
Never go silent. Communicate your thought process clearly: “Here is what I am trying to accomplish: I need to aggregate user orders by month and filter for top spenders. My first instinct is using a window function, but let me talk through how the grouping behaves first.” Interviewers frequently provide helpful hints if they see you possess strong conceptual problem-solving instincts.
4. Is Python mandatory for all data analyst interviews?
SQL is universal and mandatory. Python or R is required at approximately 60% of modern technology and high-growth companies, particularly for roles involving predictive analytics, statistical hypothesis testing, and automation.
5. How do I demonstrate experience if I have never held a formal data analyst job?
By building a public GitHub portfolio of realistic end-to-end projects. Rather than repeating generic Kaggle Titanic datasets, build projects with real-world business KPIs, dirty data, and clear README business conclusions. Generate project blueprints using our free Portfolio Project Generator.
6. What is the most common reason qualified candidates fail data analyst interviews?
Failing to bridge technical output with commercial business value. Many candidates can write complex SQL queries, but struggle when asked: “Now that you have this query result, what exact business action would you recommend the VP of Marketing take tomorrow morning?”
Published by the SkillRoadmaps Editorial Team | Updated for 2026 Industry Standards