
Navigating modern corporate finance requires far more than basic spreadsheet knowledge; mastering a rigorous financial modeling roadmap separates entry-level bookkeepers from elite corporate finance and investment banking analysts. Financial modeling is the craft of building dynamic, mathematical representations of a company’s historical performance and projected financial future. In this structured guide, you will master the five core modeling tiers, learn industry-standard Excel architecture, explore valuation frameworks, and build a resume-defining modeling portfolio tailored for top corporate finance roles.
| Skill Pillar | Core Analytical Focus | Primary Industry Deliverable | Estimated Timeline |
|---|---|---|---|
| Pillar 1: Financial Accounting Foundations | GAAP/IFRS rules, working capital mechanics, revenue recognition | Audited historical financial reconstructions | Weeks 1–3 |
| Pillar 2: Dynamic Excel Architecture | INDEX/MATCH, XLOOKUP, dynamic naming, error handling | Dynamic 3-statement integrated forecast models | Weeks 4–7 |
| Pillar 3: Corporate Valuation (DCF & Comps) | Unlevered free cash flow, WACC, sensitivity tables, multiples | Enterprise and equity valuation pitch decks | Weeks 8–11 |
| Pillar 4: Advanced Transaction Modeling | Accretion/dilution, sources & uses, debt paydown sweeps | M&A merger models & leveraged buyout (LBO) waterfalls | Weeks 12–16 |
What Is Financial Modeling and Why Is It in High Demand?
At its core, a financial model is a quantitative decision-making engine. Executives, private equity sponsors, and investment bankers rely on financial models to evaluate strategic acquisitions, calculate debt capacity, allocate capital expenditures, and guide investor expectations. According to labor economics published by the U.S. Bureau of Labor Statistics, employment of financial analysts is projected to grow faster than the average for all occupations, with top compensation packages awarded to professionals possessing advanced spreadsheet automation and valuation capabilities.
Before writing a single formula, aspiring analysts must understand why financial modeling demands strict discipline. Unlike standard academic math, corporate financial models must be dynamic, auditable, and resilient to sudden changes in macroeconomic assumptions. A properly engineered model enables leadership to adjust revenue growth assumptions or interest rates by a few basis points and instantly observe the exact downstream impact on cash balances and dividend distributions.
If you are planning your transition into corporate finance or analytics, evaluating compensation and career paths early is critical. You can benchmark salary potential across technical disciplines using our interactive Tech Salary & Bootcamp ROI Calculator or map out your long-term milestones with the Career Roadmap Planner.
Phase 1: Accounting Foundations and The Three Financial Statements
The single biggest mistake self-taught modelers make is jumping straight into Excel shortcuts before understanding double-entry accounting mechanics. If your understanding of debits, credits, and balance sheet reconciliation is shaky, your formulas will inevitably break under scrutiny. A production-grade financial model rests upon the seamless, circular integration of three primary accounting statements:
- The Income Statement: Summarizes operational performance over a specific fiscal period. It tracks gross revenues, cost of goods sold (COGS), operating expenses (OPEX), depreciation, interest expenses, and corporate income taxes down to bottom-line Net Income.
- The Balance Sheet: A snapshot of corporate financial health at a precise moment in time. It enforces the fundamental accounting equation:
Assets = Liabilities + Shareholders' Equity. - The Statement of Cash Flows: The ultimate reality check in corporate finance. It reconciles Net Income back to actual cash generated across operating activities (CFO), investing activities (CFI), and financing activities (CFF).

Figure 1: Complete data flow architecture connecting the three core financial statements in corporate modeling.
How the Statements Interconnect in a Dynamic Model
To construct an unbreakable three-statement financial model, you must master the structural linkages between each statement. When Net Income is calculated at the bottom of the income statement, it flows directly into two distinct destinations: it serves as the starting line item for the Operating Cash Flow section, and it adds to the beginning balance of Retained Earnings within Shareholders’ Equity on the balance sheet.
Similarly, non-cash depreciation expense recorded on the income statement is added back on the cash flow statement, while historical capital expenditures (Capex) from investing activities update the gross Property, Plant & Equipment (PP&E) schedule. Finally, the net change in cash across all three cash flow segments updates the Cash and Cash Equivalents line on the balance sheet, closing the loop and forcing the balance sheet to balance to zero without manual plugs.
Phase 2: Modern Excel Architecture and Financial Best Practices
Professional finance teams adhere strictly to Wall Street financial modeling conventions, such as the FAST standard (Flexible, Appropriate, Structured, Transparent). Clean modeling structure prevents catastrophic calculation errors that have historically cost financial institutions millions of dollars.
Universal Financial Formatting and Color Coding Standards
Every cell in a professional financial model must communicate its purpose visually through strict color conventions:
- Blue Font (Hex #0000FF): Hardcoded numerical inputs and historical facts (e.g., historical revenue numbers, tax rates, transaction dates).
- Black Font (Hex #000000): Dynamic formulas, calculations, and mathematical references (e.g., sums, margins, growth percentages).
- Green Font (Hex #008000): Cross-sheet or external workbook references linking between tabs.
- Red Font (Hex #FF0000): Warning alerts, balance check flags, and integrity diagnostics.
- Yellow Background Fill: Key scenario toggle switches and executive sensitivity variables.
Essential Formulas for Production Models
Modern corporate modeling eliminates obsolete, fragile functions in favor of high-performance lookup engines. Aspiring analysts should bypass traditional nested VLOOKUP functions and master modern lookup formulas:
INDEXandMATCH: Two-dimensional dynamic matrix lookups that maintain integrity even when columns are inserted or deleted.XLOOKUP: Fast, bidirectional lookups featuring native error handling and exact match defaults.SUMIFSandCOUNTIFS: Multi-criteria data aggregations essential for summarizing departmental trial balance data.EOMONTHandEDATE: Dynamic timeline automation ensuring exact calendar and fiscal month increments.MINandMAX: Non-linear constraints for modeling debt repayment limits and cash sweeps without circular references.
For analysts who also leverage data extraction and database queries in modern FP&A environments, combining spreadsheet modeling with structured database skills is a massive competitive advantage. Be sure to study our guides on How to Learn SQL in 30 Days and the foundational Data Analyst Career Roadmap.
Phase 3: Valuation Frameworks — DCF, Comps, and Precedents
Once your three-statement operating model projects five to ten years of performance into the future, the next pillar in your financial modeling roadmap is corporate valuation. Investment banking pitch books and private equity investment memos rely on intrinsic and relative valuation methodologies.
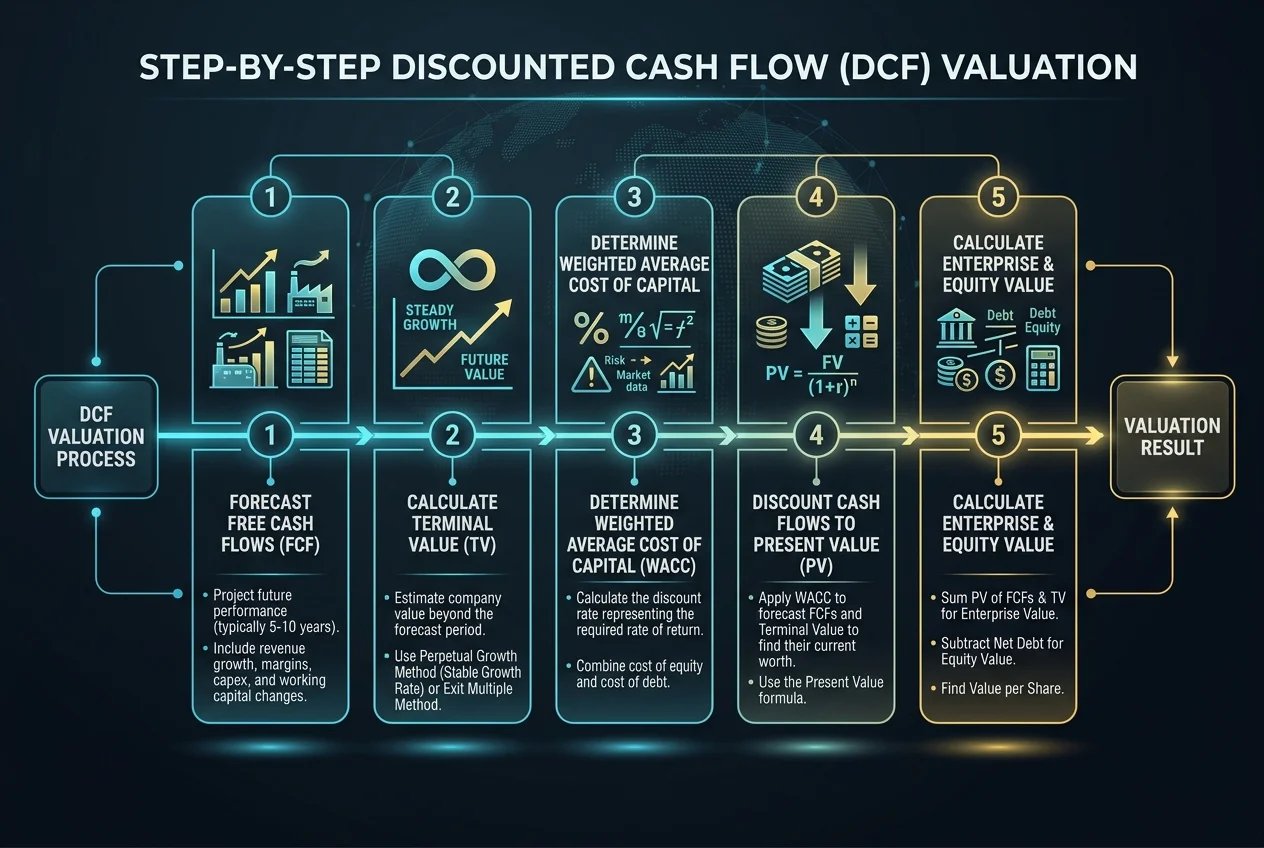
Figure 2: The five sequential phases of a professional Discounted Cash Flow (DCF) valuation workflow.
The Mechanics of Discounted Cash Flow (DCF) Valuation
A Discounted Cash Flow model values a business based on the present value of its future cash flows. The valuation process follows five disciplined mathematical steps:
- Forecast Unlevered Free Cash Flow (UFCF): Project cash generated purely by operations, independent of capital structure:
UFCF = EBIT * (1 - Tax Rate) + Depreciation - Capex - Change in Net Working Capital. - Calculate Terminal Value (TV): Estimate enterprise worth beyond the explicit projection horizon using either the Gordon Growth Model (Perpetual Growth) or the Exit Multiple Method.
- Determine Weighted Average Cost of Capital (WACC): Calculate the firm’s blended cost of financing across equity and debt using the Capital Asset Pricing Model (CAPM).
- Discount Cash Flows to Present Value: Discount all projected UFCF streams and the terminal value back to the valuation date using the calculated WACC.
- Calculate Enterprise Value and Implied Equity Value: Sum present values to derive Enterprise Value, subtract Net Debt (Total Debt minus Cash), and divide by diluted shares outstanding to calculate target fair share price.
Comparable Company Analysis and Precedent Transactions
Because intrinsic DCF models are sensitive to growth and discount assumptions, analysts benchmark their results against market-based relative valuation. You will aggregate public market metrics (such as EV/EBITDA, EV/Revenue, and P/E ratios) from official filings via the U.S. Securities and Exchange Commission (SEC) EDGAR Database to establish high, median, and low valuation ranges displayed in an executive “football field” valuation chart.
Phase 4: Advanced Transaction Modeling — M&A and LBO Models
At the apex of corporate finance modeling sit transaction-driven frameworks: Merger & Acquisition (M&A) models and Leveraged Buyout (LBO) models. These models evaluate transformational corporate events and demand mastery of complex debt schedules.
| Model Archetype | Primary Strategic Purpose | Key Analytical Deliverables | Target Industry Domain |
|---|---|---|---|
| Accretion/Dilution M&A Model | Assess pro forma financial impact of combining two corporations | Pro forma EPS accretion, synergy realization schedules, purchase price allocation (PPA) | Investment Banking & Corporate Development |
| Leveraged Buyout (LBO) Model | Evaluate target company acquisition using high debt leverage | Debt paydown waterfalls, IRR calculations, multiple of invested capital (MOIC) | Private Equity & Principal Investing |
| Project Finance Model | Assess long-term infrastructure assets funded on non-recourse debt | Debt service coverage ratio (DSCR), life-of-loan coverage ratio (LLCR) | Renewable Energy & Infrastructure Funds |
| Restructuring / 13-Week Cash Forecast | Monitor liquidity and solvency during financial distress or chapter 11 | Weekly cash receipts, vendor disbursements, liquidity covenant tracking | Turnaround Consulting & Distressed Debt |
The Mechanics of an LBO Waterfall
In a Leveraged Buyout model, an investment sponsor purchases a stable, cash-generative target company using a modest equity contribution (typically 30%–40%) and substantial tranches of senior bank debt and subordinated mezzanine notes (60%–70%). Over a 5-year investment horizon, the company’s generated free cash flow is swept to pay down the debt principal. Upon exit, the private equity firm realizes amplified equity returns measured via Internal Rate of Return (IRR) and Multiple on Invested Capital (MOIC).
Phase 5: Building a High-Impact Financial Modeling Portfolio
Recruiters in private equity, investment banking, and strategic FP&A do not evaluate candidates based on generic certificates alone. They look for live, audited modeling workbooks demonstrating pristine formatting and commercial realism. If you need inspiration for structuring projects that prove analytical capability, explore our free Portfolio Project Generator.
Three Flagship Projects Every Aspiring Analyst Needs
- Project 1: Public Company 3-Statement Forecasting Model: Select a publicly traded company on SEC EDGAR. Pull 3 years of audited 10-K data, build a supporting schedule (Depreciation waterfall, working capital schedule, debt roll-forward), and forecast 5 years of integrated operations with bull, base, and bear scenario toggles.
- Project 2: Complete DCF & Football Field Valuation: Take your operating forecast, compute the company’s cost of capital using live market data, discount cash flows, and generate a dynamic sensitivity table mapping exit multiples against WACC percentages.
- Project 3: Target M&A Synergy & Purchase Price Allocation: Model the hypothetical strategic merger of two mid-cap competitors. Calculate transaction fees, goodwill creation, after-tax synergies, and pro forma EPS accretion/dilution across 100% cash, 100% stock, and 50/50 financing mixes.
For technical candidates considering cross-disciplinary cloud skills or infrastructure management alongside finance, our latest guide on the AWS Cloud Practitioner Study Guide breaks down cloud infrastructure and budgeting tools essential for modern fintech engineering.
Frequently Asked Questions About Financial Modeling
How long does it take to learn financial modeling from scratch?
For individuals with basic business or accounting literacy, mastering core three-statement modeling and DCF valuation typically takes 8 to 12 weeks of focused, daily practice (approximately 10 to 15 hours per week). Reaching fluency in complex transaction models like LBOs and M&A mergers generally requires an additional 6 to 8 weeks.
Do I need to learn Python or SQL for financial modeling?
While traditional Wall Street investment banking remains anchored in Microsoft Excel, high-growth tech companies and quantitative asset managers increasingly demand hybrid analysts who can query transactional data with SQL and automate sensitivity runs in Python. Learning Excel first is mandatory, followed by SQL for large-scale data extraction.
What is the difference between FP&A modeling and Investment Banking modeling?
FP&A (Financial Planning & Analysis) models focus internally on budgeting, departmental headcount forecasting, and operational variance analysis against actual performance. Investment banking models focus externally on valuation, capital structuring, mergers and acquisitions, and shareholder returns during transactions.
What are the most recognized certifications in financial modeling?
The two most widely recognized certifications in the financial modeling industry are the Financial Modeling & Valuation Analyst (FMVA) offered by the Corporate Finance Institute (CFI) and the Certified Financial Modeling (CFM) program. Both emphasize practical, scenario-based Excel assessments.
Why is circularity dangerous in financial models and how is it resolved?
Circularity occurs when an output formula loops back as an input variable (e.g., interest expense depends on average debt, which depends on cash flow, which depends on net income, which depends on interest expense). Circular loops can crash Excel workbooks; professionals resolve them by calculating interest expense on beginning debt balances or implementing manual circuit breakers.